In the last report, I noted the risk of a sharp drop. Bitcoin broke below 90k, then fell to 80k. It is now back to the price range seen in April.
What is the state of the market, and what could shape the next move?
This report was independently authored by Ryan Yoon, separate from Tiger Research’s views.
1. All Risk Assets Fell, but Crypto Fell More
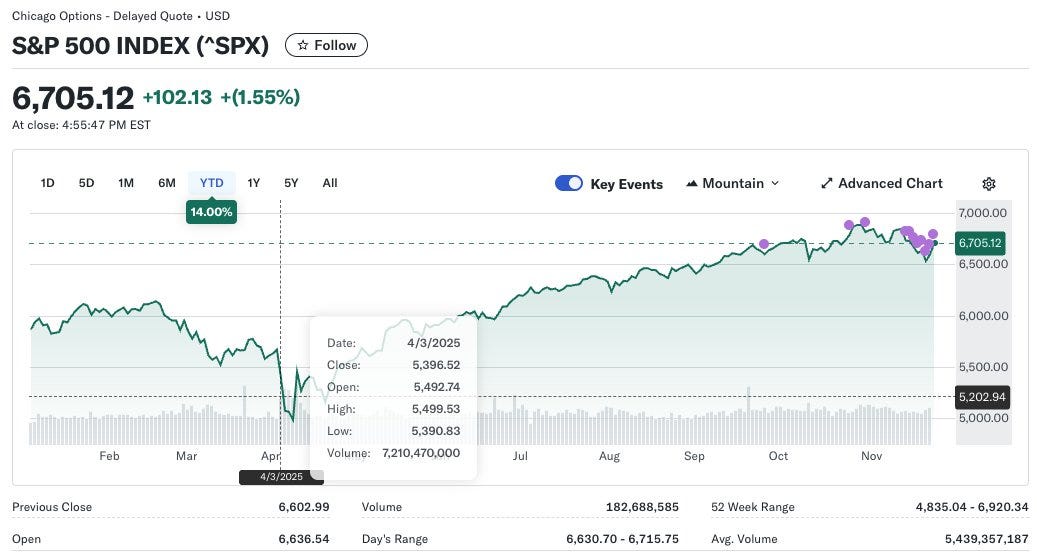
The broad crypto market had already been weak, then dropped even further as the global market corrected. Bitcoin was not the only asset hit. Total crypto market cap is now back at April levels.
Compared with the S&P 500 and Nasdaq, the drawdown in crypto is far deeper.
There is no single cause. AI bubble fears, weaker rate cut expectations, and risk-off flows all play a part. But fear itself seems to be the main driver. The crypto Fear & Greed Index hit one of its lowest levels in a year.
So what do Bitcoin’s on chain signals tell us now?
2. Strong Bid Stands Near 84k
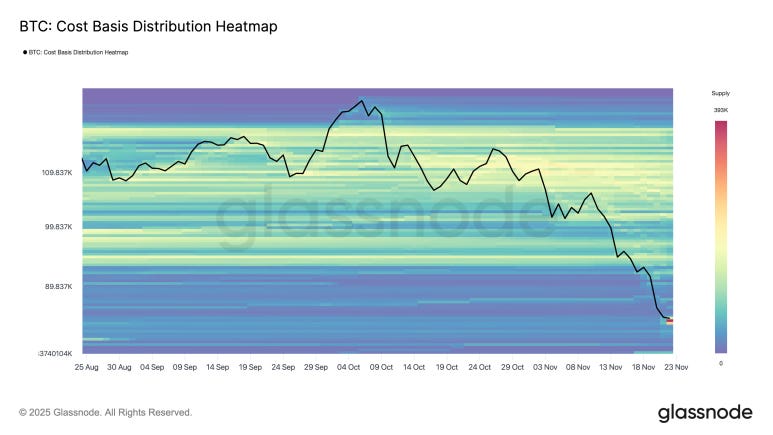
As Bitcoin fell, clear buy the dip demand appeared.
This zone matches the range where Bitcoin moved sideways in April before it moved up. Many buyers entered at that time, and their demand now shows up again. This creates a dense buy band near 84k on the chart.
This level forms a possible support zone. But if price breaks below it, these buyers fall into loss, which can add more sell pressure.
This leads to two different moves:
For mid to long term buyers: this zone is suitable for slow, split buys
For short term traders: a tight stop below support is the more rational setup
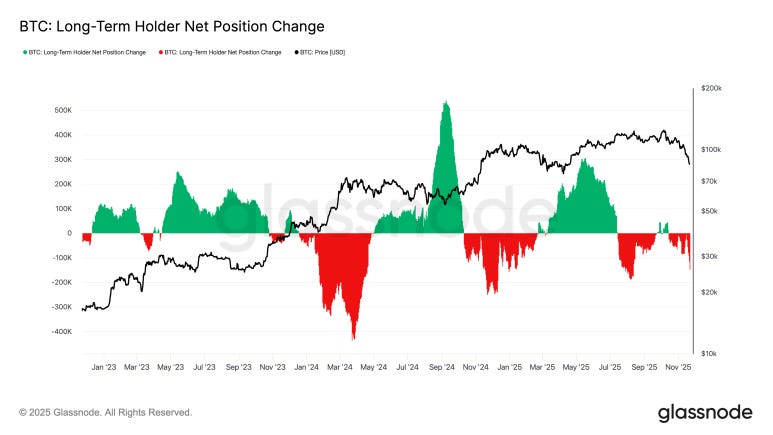
3. Long Term Holders Keep Selling, but the Pattern Changed
Long term Bitcoin holders tend to accumulate during sideways or rising markets and sell when they believe the price is near a peak. What stands out now is that the size of these sell flows keeps getting smaller, and the difference becomes clear when comparing 2025 with 2024, where the reduction in scale is pronounced.
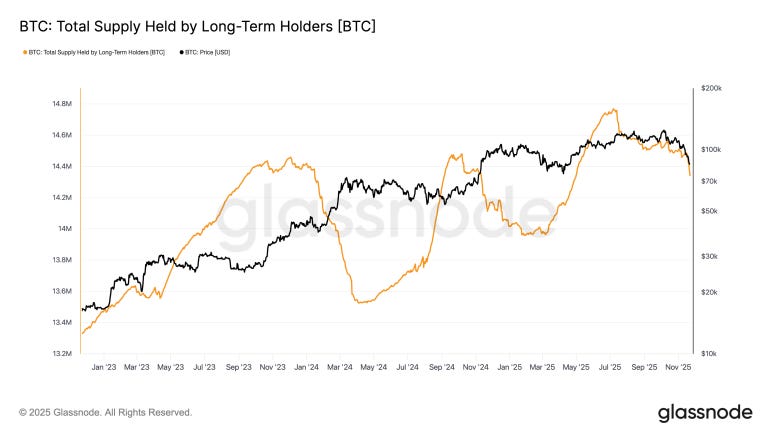
I see this pattern as a result of the large shift in long term supply during the first half of 2024, when coins moved from individual long term holders to institutions at a steady pace.
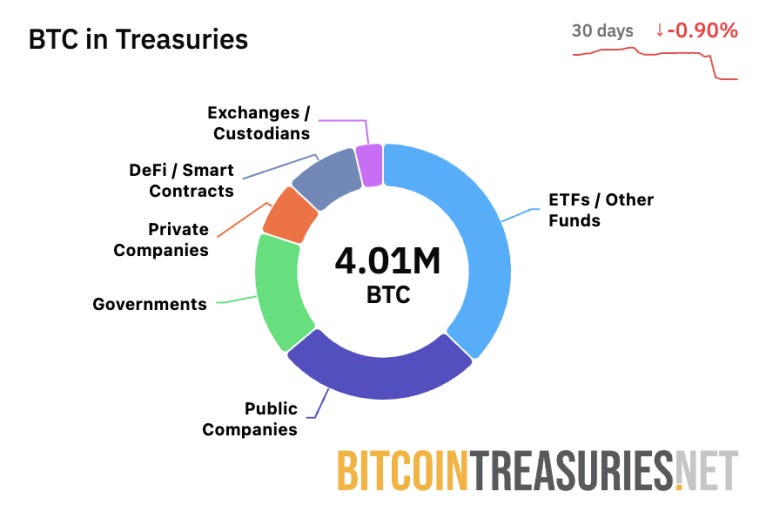
Data from BitcoinTreasuries shows that out of 21 million BTC, about 4 million are held by ETFs, firms, and governments. This means the market is now driven by players who tend not to sell fast.
The coins absorbed by institutions are locked again as long term supply. This creates a supply squeeze where fewer coins are available to sell.
So LTHs still sell some coins, but the heavy dumping seen in past cycles has faded. Most weak holders are already gone. What remains is mostly institutional rebalancing, not forced selling.
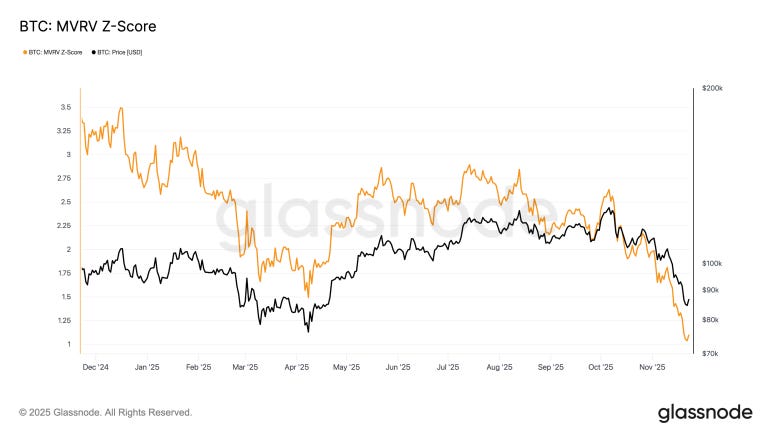
4. Bitcoin Near Year’s Low on MVRV
MVRV compares the market price with the average cost basis of all participants.
A low value means price is near or below most investors’ entry level. This often appears near market bottoms.
The MVRV-Z Score shows this more clearly. As of late November 2025, it has dropped into a key zone.
The current Z Score sits between 0.00 and 1.10, the undervalued zone.
This area often marks a statistical turn, where the slope of returns becomes steep.
The recovery in early 2023 also began in this zone, driven by institutions and long term holders.
5. Active Investor Support Has Broken
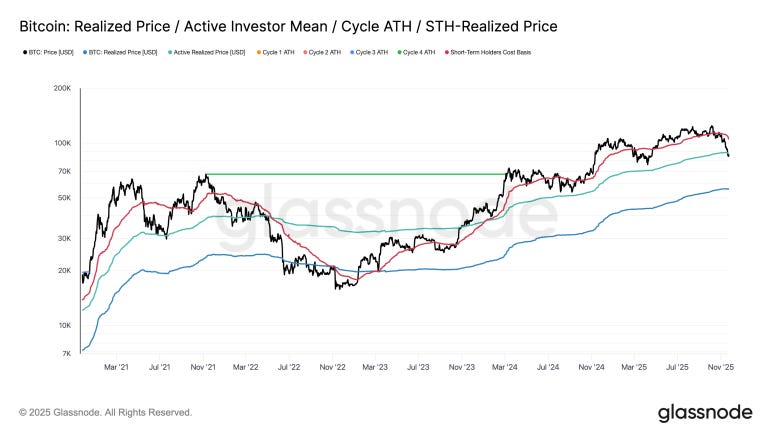
Even with stronger institutional demand and low MVRV, the cost basis chart shows risk.
Price has already dropped below the short-term holder cost basis, and now it has also broken below the active investor mean, the last major support.
The meaning is simple: the active investors who supported the market are now underwater. In past bull corrections, the price bounced here. Not this time.
This line, near 87k to 88k, now turns into a strong resistance level that price must reclaim.
6. Split Buys and Tight Stops
Signals look mixed.
Bitcoin looks undervalued on MVRV, but the break of cost basis levels means downside risk is still open. Below undervaluation, there can be deeper undervaluation.
So rather than chase or sell in fear, two checkpoints matter:
Key Support: Watch if the 84k buy zone holds
Reclaim Signal: If price moves back above 88k, a sharp rebound is possible
For now, the most data-driven plan is slow, split buys with a focus on these two levels.
Disclaimer
This report was authored by Ryan Yoon and published via Tiger Research. The views expressed are solely those of the author(s) and do not reflect Tiger Research’s views. Neither the author nor Tiger Research warrant the accuracy or completeness of the information. We disclaim liability for losses arising from use of this report. This document is for informational purposes only and should not be considered investment, legal, or tax advice.
Terms of Usage
When citing this report: 1) attribute the original author, 2) state ‘Published via Tiger Research’, 3) include the Tiger Research logo. Restructuring or commercial use requires separate negotiation with the author. Unauthorized use may result in legal action.

