The author of this report may personally hold a material position in ZRO, ZK, and ARB, The author has not purchased or sold any token for which the author had material non-public information while researching or drafting this report. These disclosures are made consistent with Delphi’s commitment to transparency and should not be misconstrued as a recommendation to purchase or sell any token, or to use any protocol. The contents of each of these reports reflect the opinions of the respective author of the given report and are presented for informational purposes only. Nothing contained in these reports is, and should not be construed to be, investment advice. In addition to the disclosures provided for each report, our affiliated business, Delphi Ventures, may have investments in assets or protocols identified in this report. Please see here for Ventures’ investment disclosures. These disclosures are solely the responsibility of Delphi Ventures.
1. Introduction
In launching the first vampire attack in crypto history, SushiSwap provoked a reluctant Uniswap into launching UNI. Uniswap airdropped 15% of the supply to its 250K users, with the minimum 400 UNI airdrop worth $3.6k today. Uniswap’s airdrop set the standard for token go-to-market.
At their best, airdrops decentralize the protocol, reward early users, align incentives, and solidify a community. At their worst, airdrops alienate the user base, curb hard-earned momentum, contaminate community discourse, and leak massive amounts of value to sybils.
Airdrops have become increasingly scrutinized and are rarely celebrated now. Entitled users and tone-deaf project teams sit at opposite ends of a polarized spectrum. Airdrops have taken on a PvP dynamic between users and the protocol, which is causing many to wonder if airdrops are still viable. In this report, we will explore recent airdrops, analyze protocol health pre/post airdrops, and discuss potential solutions for the issues facing token launches.
2. Airdrop Frenzy
Since the UNI airdrop, we have seen a number of high-profile airdrops that have rewarded early adopters, including dYdX, ENS, Jito, Arbitrum, and many more. This strategy worked well for many projects in attracting capital and users. Users started expecting a future airdrop from every new project, and projects sustained this expectation by saying that their airdrops were “returning part of the value created to their users.”
Returning value to users was a smart incentive, especially when attracting liquidity and attention is what can make or break a project. Airdrops also helped projects initially distribute their token supply to a large set of users, making Governance more distributed. The expectation of a future airdrop was often enough for degens to move their attention and liquidity from established protocols to riskier, untested protocols.
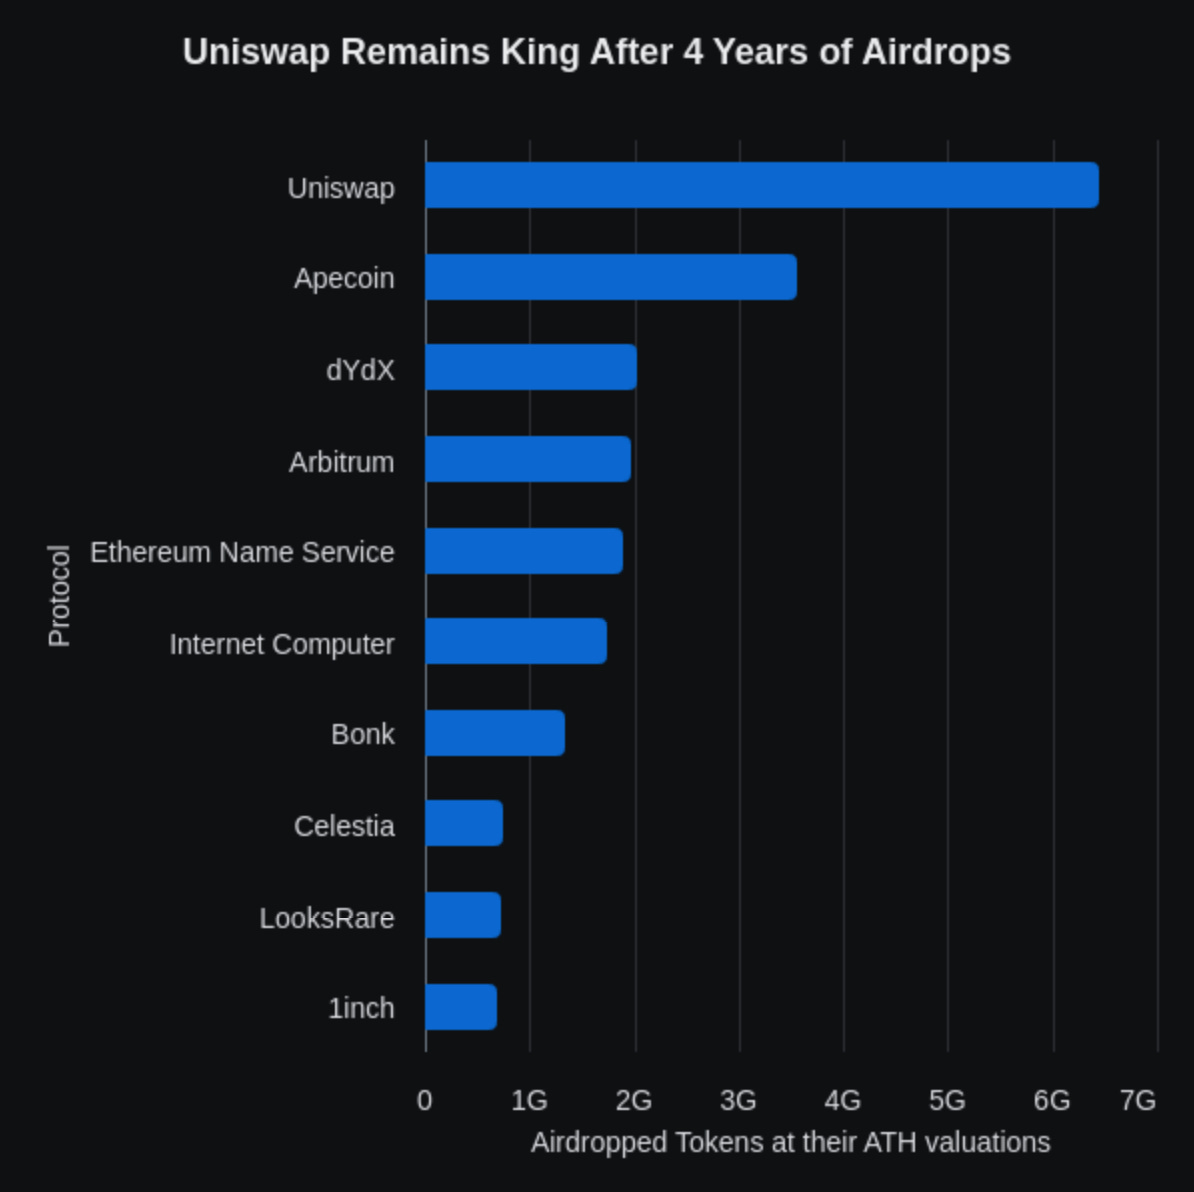
Not all airdrops are equal. Some, such as Internet Computer and APE coin, have mostly trended downward in price since the airdrop. Meanwhile, airdrops such as BONK (280x), TIA (2.5x), and UNI (2.9x) are trading at multiples of their launch valuations.
Four of the top 10 airdrops distributed over a billion dollars each to their early users and community members. While the dYdX airdrop was valued closer to $800M at its launch, any user with over $100k in trading volume received an airdrop equivalent to $60K.
The UNI airdrop outperformed every following airdrop and was worth a whopping $6.4B at its peak. The 50 biggest airdrops in crypto have distributed value worth over $26.6B. This multi-billion dollar opportunity has attracted sophisticated actors looking to exploit the system.
This has created a new cohort of crypto users – the Airdrop Farmers. Airdrop farming is extremely lucrative as the risk associated with most of these programs is usually minimal. Airdrop farmers follow a simple process: [split]
Explore the platform
Identify how the airdrop allocations will be calculated (e.g. transaction count, transaction volume, locking liquidity, etc)
Make transactions that add little value to the protocol but rank those users at the top
Repeat across several wallets
Every exciting protocol launch in crypto is now synonymous with inorganic activity from sybils and bots to acquire a large portion of the initial airdropped token supply. Airdrop farming has now developed into a small sub-sector in the industry, with airdrop-oriented CT influencers, campaign platforms, airdrop farming applications, and the farmers themselves.
This farming activity heavily skews application performance and traction metrics. To counter this farming activity, airdrop criteria have evolved significantly since the UNI drop. Protocol and application teams know this behavior and have now started counter-farming such users through the promise of the future airdrop or their points program.
3. Evolution of Airdrop Design
Airdrops started by retroactively rewarding users for their behavior (trading volume on dYdX, registering an ENS domain, etc.). But now, most airdrop programs follow an extensive points program, wherein the protocol team determines how to value user behavior and allocates tokens accordingly.
The UNI airdrop started with a flat reward (400 tokens) for each swapper. Then, we saw tiered airdrops, where protocols started to make a general tiered distinction between users, and the airdropped amount within each tier remained constant (Jito). The Optimism team popularized multiple criterion-based airdrops, with qualifying users receiving incremental tokens for each criterion they satisfy. This methodology was utilized by many protocols, including Arbitrum and zkSync. We now observe most teams using linear allocation in their airdrop strategies, with Ethena and Kamino being recent examples of this approach.
Another trend that has become popular in the past year is airdropping tokens to strong crypto communities that aren’t direct users of your protocol but help improve the project’s visibility. Milady, Pudgy Penguins, and MadLads have received several popular airdrops in the past year, including Celestia, Ethena,
LayerZero, Wormhole, and zkSync. In my opinion, this trend was popularized due to the success of the Bonk Airdrop, which distributed tokens to many communities in the Solana Ecosystem.
In the remainder of the article, we dive deeper into how protocol usage changes post-airdrop and provide some new methods for understanding user behavior and organic traction. The aim is to provide users and investors in the ecosystem with a better toolkit to measure true usage that they can utilize to improve their liquid investment process.
4. LayerZero
LayerZero is an interoperability protocol that connects blockchains, allowing developers to build seamless omnichain tokens and applications. The most popular application of LayerZero’s protocol is bridging assets from one chain to another.
If you aren’t aware of these massive clusters, you missed out on the biggest campaign to identify the inorganic usage of a protocol. LayerZero recently concluded its sybil identification campaign that was conducted in two phases:
Self-Reporting and Initial Identification
Open community bounty to identify sybil clusters
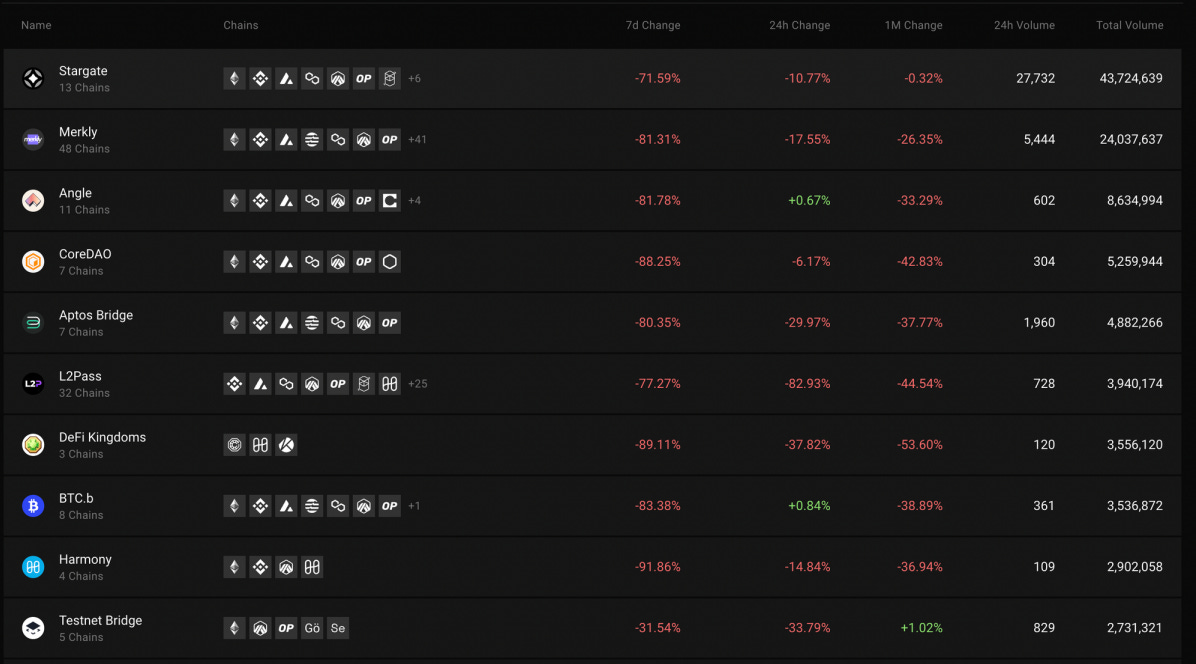
Even after these 2 phases of identifying and eliminating airdrop farming operations, many Sybil wallets bypassed the filtration and collected their now slightly larger share of rewards. One week after announcing the snapshot for their airdrop. Activity across the biggest dApps had dropped significantly, with at least 70% WoW drawdowns across the board.
4.1. Applications LayerZero team considers to be Sybil farming dApps
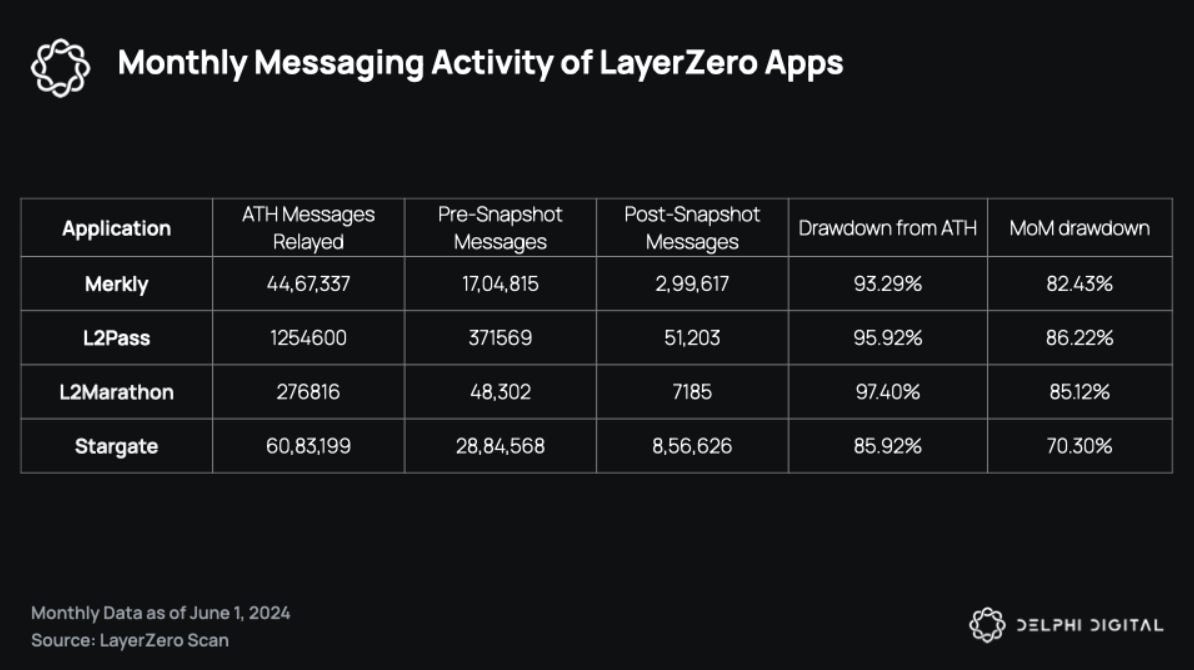
In their blog post explaining airdrop qualification and Sybil detection, the team mentioned that wallets interacting heavily with applications like Merkly, L2Pass, and L2Marathon (apps with transactions like circling a low-value NFT across chains) are likely Sybil wallets.
The monthly usage metrics for these dApps show a sharp decrease after the snapshot date. The LayerZero team has correctly categorized many of the transactions originating from these apps as Sybil-driven, but the large drop in activity has hit all LayerZero-based applications.
The number of messages relayed for Stargate, the flagship application of the LayerZero protocol, also dropped by 70% in the month following the snapshot announcement. The applications labeled as Sybil dominated have dropped between 82-86%. There are 2 factors that explain the rapid decrease in volume across all LayerZero applications –
The majority of activity on all LayerZero applications (including applications like Stargate) was airdrop farming-driven
Airdrop farmers have moved to use other bridging applications like deBridge for its upcoming airdrop, leading to an overcorrection in transaction volume
LayerZero saw its first day of relaying fewer than 40,000 messages across 80 supported chains on 19th May (after 422 days). Many chain paths to and from chains like Polygon, BNB chain, Gnosis Chain, and Celo were likely being used by airdrop farmers due to the low transaction fees associated with these chains that a user would have to pay. They allowed airdrop farmers to interact with LayerZero smart contracts on an additional chain, which was believed to be a possible airdrop criterion. The activity originating from these low-cost chains is down 93.1% from its peak and 71.2% lower from the month before the snapshot.
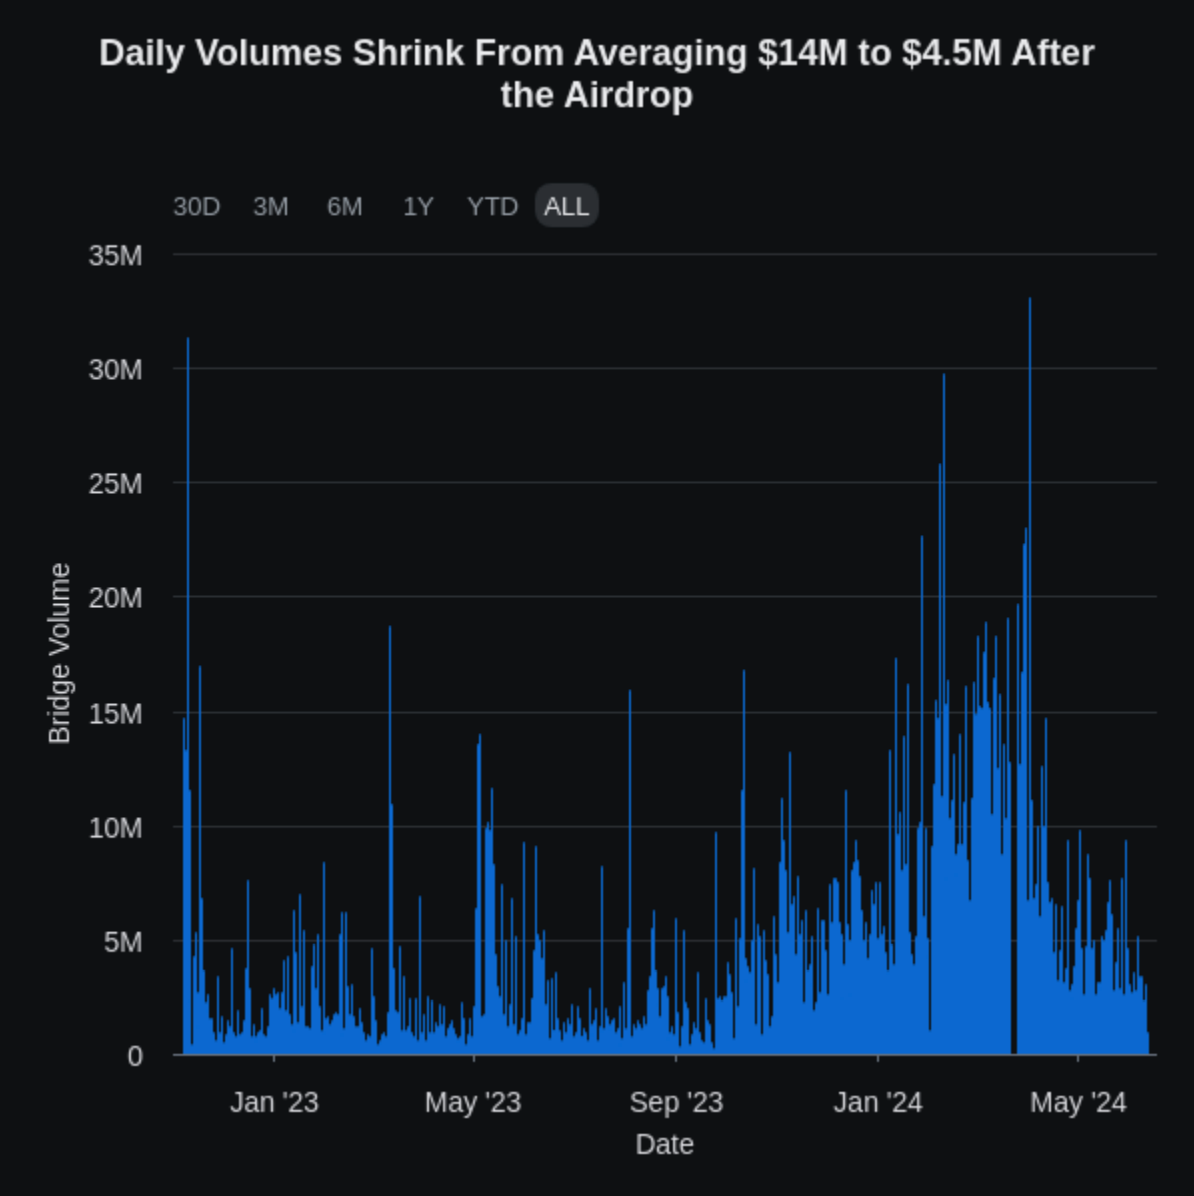
Purely examining the dip in messages relayed paints an incomplete picture. To benchmark the comparative performance, we can see that net bridging volume across all bridges dropped to $8.3B in May from $10.1B in April—a 17.8% drop. At the same time, LayerZero-powered Stargate’s bridging volume decreased from $1.67B to $406.7M—a 75% drop in transaction volume.
This occurrence is not limited to Stargate but is a recurrent theme we have seen across most bridges. Wormhole, the other major protocol in the general-purpose messaging category and interoperability solutions, airdropped its token recently and has seen a drastic drop in usage. Portal, the flagship bridge enabled by the Wormhole protocol, has dropped in bridging volume facilitated.
After these major airdrop announcements, a lot of bridging-related activity migrated to Across in the month of May, when Across did four times the combined volume of the flagship bridges for LayerZero and Wormhole. With the launch of Stargate V2 at the end of May, Stargate has rebounded in volume and has gradually flipped Across for the position of the leading bridge on June 27th.
Since its launch about two years ago, LayerZero has had almost 6M unique wallet addresses interact with it. On June 19, 2024, the team announced user token allocations and its plan to airdrop tokens to 1.28M wallets. The other 4.7M+ wallets aren’t eligible for the airdrop due to low activity, self-reporting, or third-party identification as Sybil. By doing so, has the LayerZero team themselves deemed 78% of interacting wallets as inorganic or inactive users?
5. Layer-2 Airdrops
In 2024, we have seen a number of general-purpose Layer-2s launch with minor technical advancements but new incentives and user acquisition strategies—such as Blast, Manta, and Zircuit. For Layer-1/2 protocols, we have a much wider net of metrics that we can monitor. We limit ourselves to reviewing a few of these metrics that cover different stakeholders.
5.1. Transaction Fees Generated
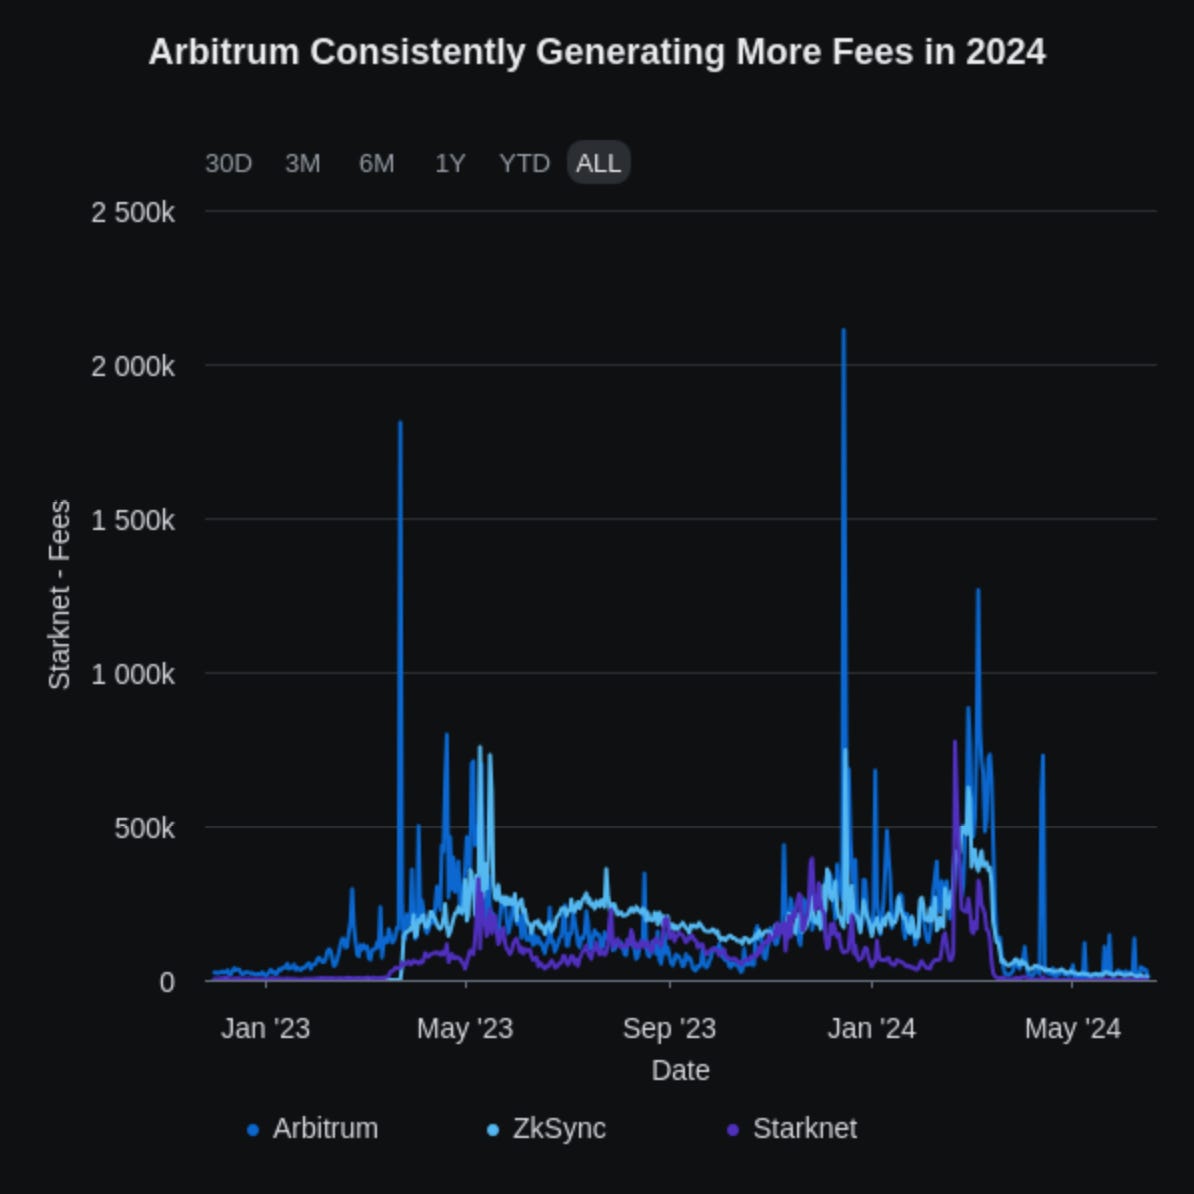
Transaction fees collected by L2 sequencers have drastically reduced since the launch of blobs (i.e. the rollout of EIP-4844) and alternative data availability layers like Celestia. Purely looking at the absolute fees collected by these L2 sequencers will always display a decrease due to the reduction in call data costs. Comparing fees collected between multiple layer-2 protocols would better estimate fee-generating demand on these rollups.
In a pre-EIP 4844 Ethereum, Arbitrum had been able to more than triple the fees they were collecting in a year from their airdrop, as fees grew from $120k-170k in March 2023 to $480k-$1.2M in March 2024. zkSync and Starknet did lead in fees collected compared to Arbitrum in the months following the ARB airdrop.
Post EIP-4844 and leading up to the ZK airdrop, zkSync generated fees on par with Arbitrum daily. However, since the snapshot announcement and subsequent token distribution, the fees collected have been trending down. We observed the daily fees paid by users falling below $10k for the first time since the launch week of the zkSync Era. Daily fees collected by Starknet have been consistently $3k from the second week of April.
Manta Pacific ran campaigns like “New Paradigm” and “Into the Blue” and added gamification around their NFTs that were later converted to token allocations. During the months of December and January, Manta was generating fees comparable to Arbitrum and zkSync even though it was using Celestia as its data availability layer. But their campaigns ended up attracting more airdrop farmers than actual users that would return to the applications post airdrop. Fees collected from transaction processing have dropped more than 95% from ATH, and Manta Pacific has not been able to generate more than $20k in daily fees since the last week of March.
5.2. Development Activity
We saw earlier that the transaction fees that any L2 can generate can become comparable to existing market leaders in the thick of airdrop farming campaigns. We look at the number of smart contracts deployed to get a different perspective or metric to measure the organic interest in the ecosystem. This metric is also fairly simple to skew on a short timeframe, but maintaining that divergence over longer timeframes is extremely difficult.
Developers need to make an informed decision to deploy, maintain, and grow a protocol on a particular blockchain. Even multichain dApps need to take a decision on which chains they would want to expand to, as it consumes time and resources that can be spent improving and growing their existing products. Moving around different chains is thus an important decision for developers compared to application end users and can be used as an indicator for gauging interest in a blockchain ecosystem. Manta whilst able to match L2s like Arbitrum and zkSync briefly in transaction fees, it was never remotely close to them in the number of contracts being deployed.
5.3. Transaction Activity and Active Users
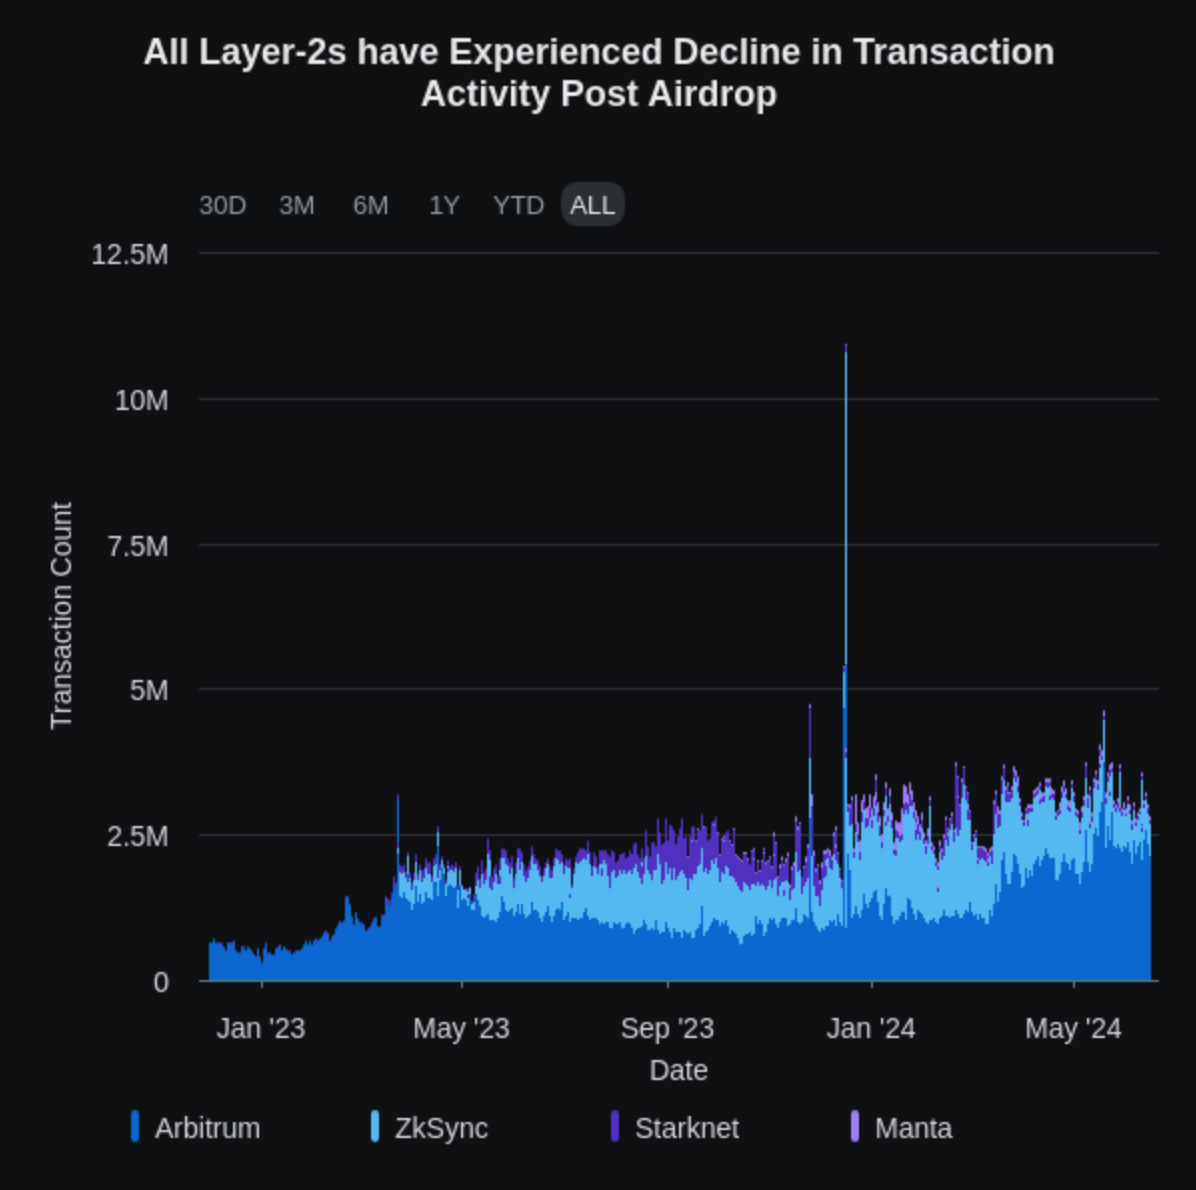
zkSync has been showing signs of a slowdown in transaction activity since April, even before the snapshot had been announced – possibly due to certain sybil activity wrapping up on the L2 and moving to farm newer protocols. Arbitrum was the most active Layer-2 ecosystem around its airdrop in March 2023, and it was still able to more than double its daily transaction count. Starknet and Manta Pacific have seen a drastic drop in transaction activity, with both L2s facilitating less than 100k transactions on most days in the past 2 months (i.e. Both these L2s have a current scaling factor of less than 0.1).
On a positive note, the transaction count and fees generated on Manta began a steady increase in the first week of June. For Manta, the number of active users on the chain has dropped below 10k, with an average of 8+ daily transactions per active wallet on the network representing a narrow base of highly active users. On chains like Arbitrum and zkSync, the average transaction count per user ranges between 2-4. Arbitrum’s recent growth in active users helps it maintain a 50% lead over Base as the most active Layer-2 by DAUs.
6. Kamino
Kamino Finance (Kamino Lend) and marginfi (mrgnlend) have been the frontrunners of Solana’s DeFi lending ecosystem. MarginFi was the category leader until March 7th, 2024, when Kamino Finance announced the snapshot date for their points program. By declaring the token distribution to be linear to points accrued about a month before the snapshot, they incentivized major depositors and borrowers (whales) on mrgnlend to migrate their positions to Kamino’s lending product.
Kamino is a very interesting case study to analyze for its airdrop strategy since it helped them efficiently execute their user acquisition plan and dethrone marginfi as the leading money market on Solana. Mrgnlend’s TVL has now stagnated below its early March TVL, but Kamino Lend’s TVL has grown by $725M. But TVL doesn’t convey the entire story behind the user behavior and protocol adoption.
The TVL on Kamino has held up decently post the snapshot date, with some users withdrawing funds, but it has rebounded back close to its all-time highs. We should observe other usage metrics to understand better the organic activity, change in activity, and protocol usage post-snapshot.
6.1. Number of interactions with Kamino smart contracts
Kamino has 2 flagship products – Kamino Lend and Kamino Liquidity. Just trying out the various features on the Kamino platform, such as lending, borrowing, providing, and withdrawing liquidity from the liquidity product, would lead to 4 interactions with the smart contracts.
One of the simplest sybil strategies includes trying out all the product’s various features to secure a minimal airdrop allocation. By breaking down the number of wallets by the number of interactions with the protocol smart contracts – we can get a ballpark estimate of the number of users experimenting with the protocol with the expectation of a minimal airdrop. Going beyond identifying the airdrop driven usage, this segmentation also helps us spot the number of power users that exist for an application (e.g. 100+ transactions initiating wallets).
About 190k of the total 390k wallets that have interacted with Kamino Protocol have initiated fewer than 5 transactions. A large fraction of these wallets are likely Sybil operations or individual airdrop farmers.
6.2. Depositors and Withdrawing Users
Protocols, especially DeFi protocols that require locking up capital with significant inorganic activity from airdrop farmers experience an outsized number of withdrawals as compared to deposit transactions post the snapshot. In Kamino’s case, the number of wallets withdrawing exceeds depositors, but the Lend product’s TVL is inching closer to its ATH in SOL-denominated TVL). Kamino is gradually losing its Airdrop farming TVL, and on the flip side, it is acquiring TVL from recurring users.
Since the snapshot for season 1 of Kamino’s Points program, the Average net flows on TVL growth days have been $23.6M compared to $23.08M for TVL contraction days. The difference between them is trivial, but the TVL growth days outweigh the TVL contraction days 55:6—representing almost 9 days of net inflows for 1 day of outflows. Since their airdrop snapshot, almost $3B of net inflows have occurred in Kamino’s Lend product.
6.3. New Versus Recurring Users
The active user count on Kamino has been declining since the airdrop and they have been able to maintain over 3k daily active users. Of these users, the share of returning users has reached 98%. Combining the results indicates that:
Kamino was able to attract many new users to use the protocol pre snapshot but can no longer do so; new wallet activity was mostly airdrop driven.
Kamino’s user base has shrunk to a smaller power user group, and much of the inorganic activity has been moving away from the platform.
The plan of action by the Kamino team to announce a linear distribution of tokens based on the points accrued was in part to attract these power users/whales from marginfi and the rest of Solana DeFi. They were very successful in doing that, but the protocol has not been able to retain a lot of the smaller users, as their airdrop allocations ended up being minuscule compared to these whales. Focusing on retaining these smaller users would’ve been detrimental as the stickiness of this capital has been historically low in EVM-based DeFi ecosystems.
7. Parcl
Parcl is a decentralized real estate trading platform. It offers city indexes that allow users to speculate on the price movements of real estate markets worldwide. Parcl’s points campaign was very popular, with almost 160k wallets on Solana interacting with the platform and driving TVL to the high of $185M.
Users could earn points by depositing liquidity, opening trade positions, and referring other users to the platform. At the end of their points program, they adopted a hybrid approach in distributing rewards with the top wallets with maximum points receiving a capped amount of tokens determined by the team. 25% of wallets interacting with the platform had fewer than 6000 points and were deemed ineligible to receive airdropped tokens. The remaining users were given a linear airdrop, i.e., pro-rata allocation to the points they earned.
7.1. TVL constantly leaving Parcl
Users have mainly been withdrawing funds from Parcl after the airdrop, with less than 12 days of net inflows since the announcement date. The average magnitude of withdrawals/outflow days ($2.25mn) also exceeds the average deposit/positive-inflow days ($447k) by a factor of 5x. TVL has shrunk by 74% to $47mn since the airdrop.
7.2. Number of Daily Transactions
For a lending protocol or yield protocol with transactions spread far apart, the drop in active users can still be explained by the low interaction frequency. But for protocols designed for trading purposes, the drawdown in Users and transactions should be the biggest concern.
Since the airdrop distribution, the number of daily transactions and unique wallets interacting with the protocol has fallen dramatically. Recently, Parcl has averaged close to ~500 unique DAUs and about 2,500 transactions on the platform daily, a sharp falloff from the 10k+ wallets that were interacting with the protocol.
7.3. How frequently do wallets interact with Parcl smart contracts?
Over 158k wallets have interacted with the Parcl smart contracts, i.e., depositing into the Liquidity pool, withdrawing funds, opening a trade position, etc., fewer than three times. It is likely that most of these wallets interacted with the protocol for farming the airdrop with no intention of continued usage post-snapshot.
7.4. Activity from Users post snapshot
We have limited the above set of event emissions to a small subset to mainly include events that involve users’ actions with their deposits on the platform. The general trend of Interactions with the protocol post snapshot has been actions like Removing liquidity, Closing an LP position, Processing settlement, and Withdrawing margin as opposed to Adding liquidity, creating a margin account, or depositing margin. All of these factors point towards Airdrop farmers exiting their positions and taking out funds from the protocol.
The Parcl team executed one of the better points and airdrop campaigns in the last six months, but the activity and users who joined the platform were driven by the airdrop incentives and have since left the platform. The sharp decrease in the activity on Parcl can be attributed to another factor: trading Real estate has lower inherent volatility, and most of the attention on Solana at the same time had been shifting towards trading memecoins with higher risks and higher rewards that appeal more to the average onchain user.
8. Jito
Jito Labs is building high-performance MEV infrastructure for Solana. Their aim is to make Solana more efficient, minimize the negative impact of MEV on users, & maximize MEV returned to users and stakers. Jito also has a liquid staking service, Jito Stake Pool, allowing users to stake their SOL tokens in exchange for Jito Staked SOL (JitoSOL) tokens that earn both staking and MEV rewards and are composable with most Solana DeFi applications.
Airdrops and Points systems aren’t necessarily a down-only event for a protocol. Teams that find a product-market fit and execute an airdrop campaign that is well-received by the community can experience continued growth. Jito was one of the earliest projects to implement a simple points program before most users became fatigued by the points meta. This campaign went under the radar as compared to most points programs today as it was launched in the depths of the bear market.
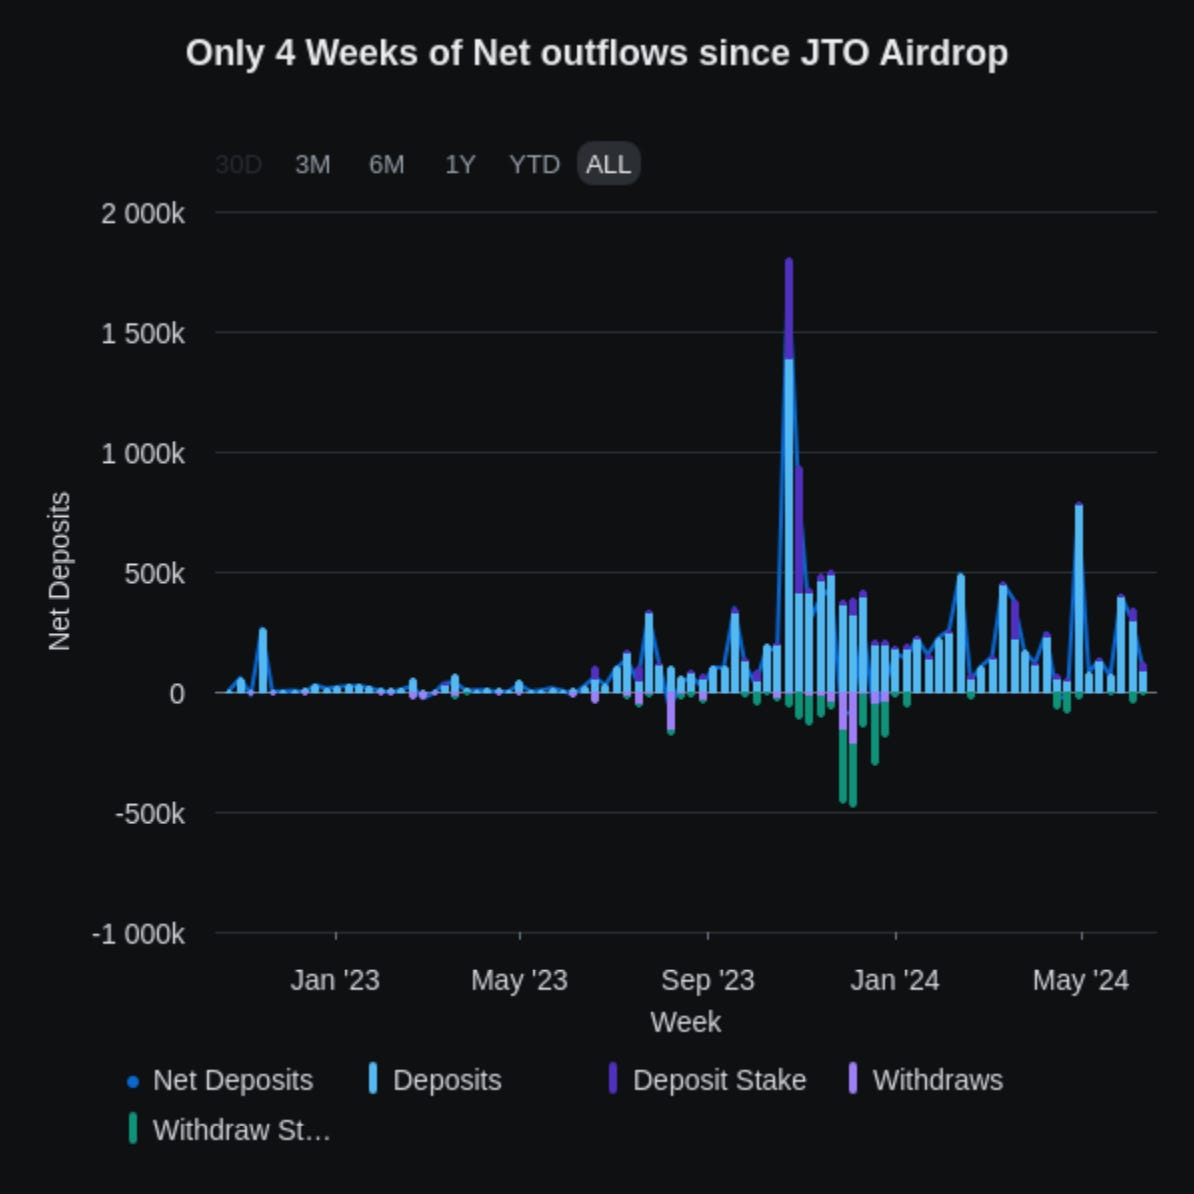
Deposit transactions have far outweighed withdrawal transactions for most weeks since the airdrop. November and December were the only months in which Withdraw SOL and Withdraw Stake transactions were even comparable to the Deposit transactions.
In the two weeks following the Jito airdrop announcement, over 10k users deposited SOL each week. Recently, we’ve seen more users utilizing the Deposit Stake function, i.e., they are migrating their stake accounts from other LSTs and validators to Jito.
The number of new users (wallets) interacting with Jito has been on par with the number of recurring users, signaling the interest in using Jito even after the airdrop.
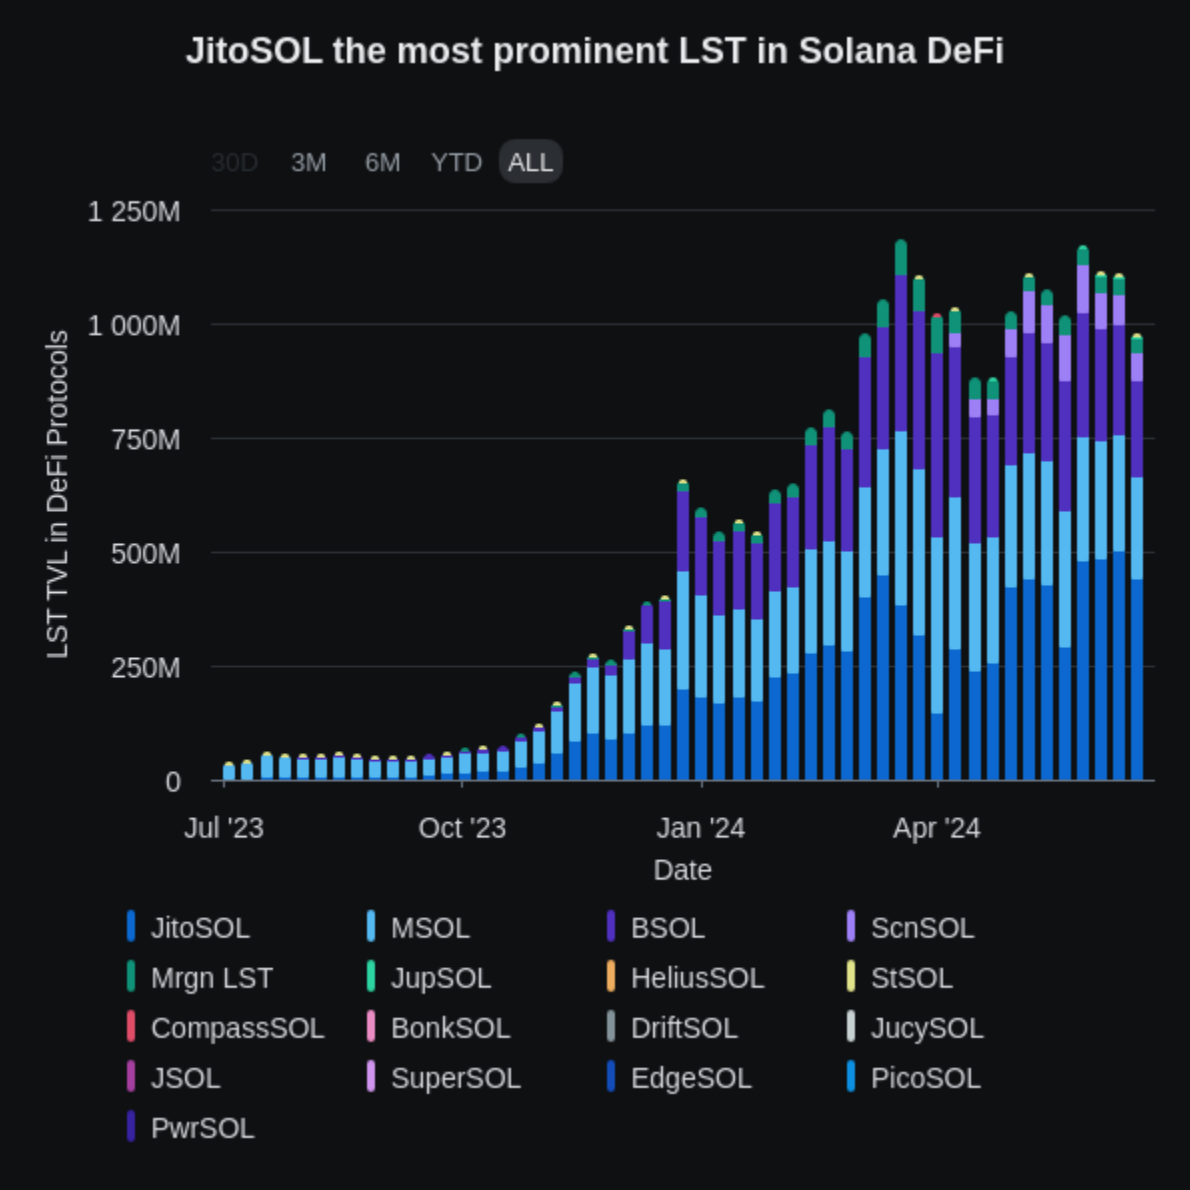
Jito’s share of Solana’s liquid staking market has grown from 43.5% to 46.2% since the airdrop, which initially looks like a small step up. This feat is, in reality, impressive because, since the JTO airdrop, a wide variety of new LSTs from ecosystem teams like Bonk (bonkSOL), Helius (hSOL), Jupiter (jupSOL), Drift (dSOL), Laine (laineSOL), Cubik (iceSOL), Pathfinders (pathSOL) have been launching with new incentives for their respective communities and users.
The Solana Liquid staking market has grown 36% in the past six months, and in the same time period, SOL staked through Jito has grown from 6.76M SOL to 11.05M SOL—a 63% increase.
From the week Jito announced their airdrop, they’ve seen 24 weeks of net SOL inflows and 5 weeks of outflows. On an average inflow week, Jito receives 227k SOL deposits, and during an average outflow week, the protocol sees 63k SOL exiting from their stake pools. This shows that until now, an average week of
inflows can counteract almost three and a half weeks of outflows from Jito’s liquid staking product.
Adoption in DeFi
The success of Liquid staking tokens hinges on their usability within DeFi and the liquidity for users to swap out of their holdings immediately. Lido’s stETH became the market leader by rapidly integrating stETH across DeFi, and the network effects and liquidity allowed it to cement its position. Similarly, jitoSOL is by far the biggest LST on Solana measured via the adoption of the token in DeFi and the available liquidity.
Jito’s airdrop is an extreme outlier, but it is an example of how one airdrop can kickstart exponential growth for an entire ecosystem. Solana’s DEX volumes now rival Ethereum Mainnet. DAUs and transaction counts exceed Ethereum Mainnet, and TVL has been on a constant climb since the End of November, i.e. since the Jito Airdrop.
9. What can we do?
The opportunity to invest in more transparent and accessible liquid markets in crypto is one of the biggest advantages over tradFi that I find amazing. The 4th Uniswap fork on the 7th Layer-2 launched this year has better real-time and publicly available analytics than many web2 public companies, who are only obligated to share their performance and financials every quarter. But the entire meta around points and airdrop farming skews the performance and traction metrics making the investment process in liquid secondary markets more difficult.
Even though most value is being realized in private markets, the market and all the publicly available information allow valuation repricing to happen over time. A large opportunity in liquid investing arises if we are able to identify the organic vs. inorganic traction that crypto products have before the rest of the market participants.
As an investor in the liquid markets, one can ask a wide range of questions and view the relevant data available to get insights into what fraction of a protocol’s usage is/was organic. We can observe a multitude of data points before the airdrop snapshot, after the snapshot period, and in the steady state after the airdrop.
9.1. Active Users
Daily Active Users (DAU) and Monthly Active Users (MAU): Track these metrics over time to see if there’s a drop-off after the airdrop snapshot is announced. A sustained number of active users post-airdrop indicates more organic engagement.
Given the nature of Airdrop farming in crypto right now, almost every protocol will observe a dropoff in active user count post-airdrop. So, to better ascertain the protocol’s ability to retain users, we can measure and compare Active users to competitors, other projects in the same L1/L2 ecosystem, and similar products on other chains.
9.2. Retention Rate
User Retention Rate: Measure how many users continue to use the platform after pre-determined periods (e.g., 1 week, 1 month) post-airdrop. Higher than usual retention rates suggest that users find ongoing value in the protocol
9.3. New User Share
New User Share: Measuring the fraction of DAUs or WAUs that are new users as compared to recurring users. A higher share of new users signals better PMF in a post-airdrop environment, as the largest incentive to spin up new wallets interacting with the protocol is reduced drastically.
Having a high fraction of recurring users is not a bad indicator either, as most of the recurring users after the airdrop indicate the organic usage of the platform.
9.4. Transaction Value and Volume
Transaction Count: Simple metrics like monitoring the number of transactions initiated daily and the average transaction count per user before and after the airdrop. A sharp decline after the airdrop period indicates that many transactions were driven by airdrop expectations.
Median Transaction Value: Assess the total value of transactions. A consistent or increasing median transaction value post-airdrop indicates genuine usage as the low-value sybil transactions disappear.
9.5. Nature of Transactions
Feature Usage: Monitor which features are being used and how frequently. Sustained or increased use of core features post-airdrop indicates ongoing interest or product market fit. The simplest way to do this analysis is to parse through the events emitted by the protocol’s smart contracts.
9.6. Engagement Metrics
Wallet Cohort Analysis: Group wallets based on their total activity on the platform. Wallets with minimal transactions, i.e., those that test the various features and functionalities once, are strong contenders for being airdrop farming wallets that can be eliminated in the process of identifying organic activity.
Depth of Engagement: We can look at the number of transactions per user per session (e.g., trades made and features used). A high depth of engagement suggests users are deriving more value than other applications with a lower depth of engagement.
9.7. Governance Engagement
Forum and Support Activity: Monitor activity on community discussions and governance forums. High voter engagement and ongoing discussions can signal a committed user and token holder base.
10. Conclusion
Airdrops are amongst the most anticipated events surrounding crypto projects. But they have increasingly become stress tests for projects as community backlash around the snapshot announcements has become a recurring theme. This is in part due to the dilution of rewards due to high Sybil activity and protocols trying to farm users for traction metrics for extensive periods. Running anti-Sybil campaigns like LayerZero can be a prohibitively expensive endeavour that cannot be conducted by most teams.
A possible path ahead is for major protocols to conduct these anti-sybil campaigns and other smaller protocols to utilize the findings to remove Sybils from their token distribution process. I don’t believe linear airdrops are the silver bullet that can solve all challenges associated with Airdrop campaigns, as they are heavily skewed towards whales. We need to design better airdrop campaigns and set stringent eligibility criteria that are harder for Sybils to satisfy.
As participants in crypto liquid markets, utilizing the ideas and metrics shared above can help make more informed decisions before buying into tokens for projects with inflated metrics and even more inflated valuations.
Disclaimer
This report is the original document written by Delphi Digital. It is provided for informational purposes only and should not be considered investment advice. Before making any investment decisions, refer to the original document and seek professional advice. Tiger Research does not guarantee the accuracy, completeness, or timeliness of this report and is not responsible for any losses or damages resulting from its use. All disclaimers, risk warnings, and conflict of interest disclosures in the original Delphi Digital document also apply to this report.


