BTC ETFs’ Impact on Spot Market Structure
What impact these structured products have had on spot BTC market structure
TL;DR
BTC ETF approval led to increased volumes around US market hours
Trading has seen an uptick towards the end of US trading during benchmark “fixing windows”
Liquidity has improved on benchmark constituent exchanges
This week we’re looking into the impact of spot exchange-traded funds (ETFs) on Bitcoin’s market structure. The US SEC approved 11 on January 11, with 10 launching the next day. Hong Kong previously approved Bitcoin and Ethereum ETFs, launching in late April.
To examine the impact of these products we’re going to look at trading volumes and liquidity at the market close across US and Hong Kong trading hours.
Our research shows that trade volumes rose on crypto exchanges included in Bitcoin benchmark reference rates. In particular, volumes increased around the US market close following the approval of spot BTC ETFs in the US.
The increased activity between 3 pm and 4 pm New York time (US market close) is linked to the ETFs’ net asset value (NAV). Issuers calculate this based on benchmarks fixing prices, which are calculated over this hour period. More on this below and how benchmarks work below.
1. THE ROLE OF BENCHMARKS IN BTC ETFS
First a quick primer on Bitcoin benchmarks and the constituent exchanges. Each Bitcoin benchmark provides an index price, denominated in USD, for one BTC once a day. These benchmarks calculate their price based on aggregated trade data from selected exchanges.
ETF trading can contribute to increased spot Bitcoin liquidity throughout the ETF trading day as liquidity providers and market makers for the ETF trade and hedge in the spot market. The ETF benchmark fixing window can have an even more significant impact on spot trading volume.
The ETF determines its NAV based on the fixing price, which is used for share creations and redemptions. To reflect the benchmark price as closely as possible, the buying and selling of Bitcoin for creations and redemptions must occur during the fixing window. Therefore, we expect increased spot volume during this time.
Bitcoin reference rates calculate the index price based on trade data received between 3 pm and 4 pm New York time. The most common exchanges used are Bitstamp, Coinbase, itBit, Kraken, Gemini, and LMAX Digital. Each ETF then calculates its net asset value (NAV) using its benchmark index price following market close at 4 pm.
2. UPTICK IN US TRADE VOLUMES
Since the approval of spot BTC ETFs BTC trade volumes have significantly increased. Volumes rebounded in October from multi-year lows hit during the summer, when signs of an imminent ETF approval became evident. The overall market euphoria was supported by a constructive macro environment for risk assets, with market pricing in six U.S. rate cuts in December 2024.
The increase in trading activity since the launch of spot ETFs has been concentrated around US market hours. In particular, volumes during the benchmark fixing window, between 3 pm and 4 pm New York time, have improved. This changing dynamic helps to improve liquidity and price discovery in BTC markets but could also lead to increased intra-day volatility.
3. THEN AND NOW: COMPARING RECORD HIGHS
When BTC set its previous record high in November 2021 less trading took place at US market close — between 3 pm and 4 pm New York time (8pm-9pm UTC during Eastern Standard Time).
That has begun to change since the launch of spot BTC ETFs in January, as trading becomes more concentrated on US trading, especially at the end of the day. Using weekly data — which shows the average of the 5 days’ volumes during that hour — volumes have notably increased since October.
Cumulatively, there was over $17.6bn in BTC trade volume on weekdays between 8 pm and 9 pm UTC in the first quarter, making it the second most popular hour for trading, behind 3 pm UTC. As a result, the benchmark fixing window between 3 pm and 4 pm New York time accounted for over 6.7% of all volume, up from 4.5% in the fourth quarter of 2023.
4. THE DEATH OF THE WEEKEND WARRIOR
As we previously reported, the share of BTC trade volumes during weekends has consistently declined since 2021. This downward trend has been exacerbated since the introduction of spot ETFs. Currently, the BTC weekend trading volume stands at an all-time low of 16% in 2024, marking a 12 percentage point decrease from its peak of 28% in 2019. The advent of spot BTC ETFs has contributed to the accelerated widening of the gap between weekday and weekend trading volumes.
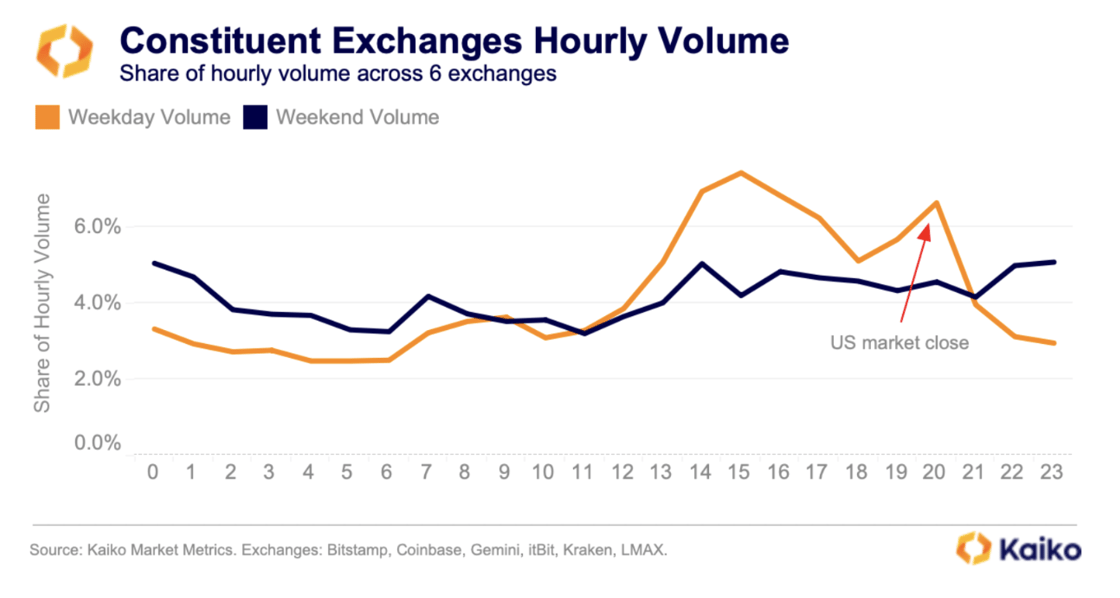
Comparing the share of trade volume on constituent exchanges between weekdays and weekends further highlights the concentration of BTC trading volume on weekdays.
During weekdays, the US market close accounts for over 6.6% of all trading volume on benchmark exchanges. In contrast, this figure drops to just over 4% during weekends, with no discernible pattern or clustering of trading activity.
5. HONG KONG ETFS MISS A BEAT
While the launch of spot ETFs in the US has significantly impacted Bitcoin trading volumes, the recent introduction of both BTC and ETH spot ETFs in Hong Kong in April has had a more muted effect.
Analysing weekly data reveals that the average BTC trading volume during the Hong Kong market close increased to $37mn the week spot BTC ETFs were launched in Hong Kong. However, it remained significantly below its peak of $73mn in March.
This is due to the fact that Hong Kong is a significantly smaller market than the US and market conditions at the time of the spot BTC and ETH ETF launches in Hong Kong differed notably from those during the US launch. The Hong Kong funds were introduced after Bitcoin’s fourth halving, during a period of stagnant price action, and coincided with outflows from many US spot BTC ETFs for the first time. Moreover, market sentiment in April was notably more bearish than earlier in the year, with BTC perpetual funding rates transitioning into negative territory.
6. BENCHMARK BOON
The impact of ETFs on spot BTC markets has been more pronounced on US-regulated exchanges. If we take the world’s largest exchange, Binance, which is not regulated in the US, we can see that the average hourly trade volume during the first quarter peaks around the open US market open. Volumes then consistently fall throughout the rest of the day. No ETF benchmarks include Binance, as most of its BTC trading volume is against stablecoins, and ETF benchmarks can only consider BTCUSD prices.
The situation differs significantly when comparing it to the largest exchange across all Bitcoin reference rates, Coinbase, which is a US-regulated exchange. On Coinbase, volumes were heavily focused on the US market open and increased to an average of $220 million at the close, during the benchmark fixing window.
7. LIQUIDITY PROFILE LOOKS GOOD
The introduction of spot BTC ETFs in the US has enhanced liquidity conditions, reflecting the market’s growing ability to handle large orders as bitcoin trading evolves. Although potential risks, such as outflows affecting liquidity during market stress, were identified, the case for ETFs boosting spot market liquidity remained strong.
Part of the argument for improving liquidity was based on ETF issuers’ so-called “authorised participants.” These firms create or redeem shares in the ETF daily based on demand. Authorised participants for US-based ETFs include firms like JP Morgan, DRW, and Jane Street. These firms have contributed to improved liquidity as price discrepancies between ETF shares and the underlying BTC have been efficiently arbitraged out of existence.
In the first quarter of the year, the average daily BTC 1% market depth has increased on US exchanges, with the institutional-focused LMAX exchange showing the most significant percentage increase.
ETFs offer a cost-effective hedging alternative for market makers, potentially reducing inventory costs and subsequently lowering trading costs for takers.
However, the impact on BTC’s cost to trade measured by the bid-ask spreads, has been mixed. Initially, spreads on top US exchanges — Coinbase, Bitstamp, and Kraken — narrowed following the launch of spot ETFs. Nonetheless, they widened again in March as volatility rose and Bitcoin reached an all-time high before declining again in Q2.
Similar to trade volume, we observe a shift in the share of BTC market depth towards US markets. The share of liquidity on US exchanges has increased to 45% since the start of the ETF-led rally in October, up from 35% a year ago.
8. CONCLUSION
The overall impact of ETFs on the Bitcoin spot market has been positive. Both trade volumes and market depth have increased this year.
The positive liquidity development has been primarily concentrated on US markets, particularly on weekdays and around US market close. This concentration could result in increased volatility outside US opening hours, potentially penalizing retail traders. Additionally, the impact on trading costs, as measured by the bid-ask spread, has been mixed.
US exchanges, which are included in Bitcoin benchmarks, benefited from improved volumes and more consistent liquidity during US market open and close.Intro
Security breaches, funds mismanagement, or bad governance, have too often been associated with cryptocurrency exchanges, causing reputational damage to the whole industry. Just last week, Mt. Gox, which was once the world’s largest bitcoin exchange, was back in the headlines a decade after its bankruptcy filing, moving thousands of bitcoins as part of a plan to repay creditors by October 31st, 2024.
This event reminds us of the importance of regularly monitoring cryptocurrency exchanges’ compliance, business practices, technology, and trading activity. Kaiko’s latest quarterly exchange ranking provides a fully transparent score for 43 cryptocurrency exchanges, based on a variety of parameters.
Disclaimer
This report is the original document written by Kaiko. It is provided for informational purposes only and should not be considered investment advice. Before making any investment decisions, refer to the original document and seek professional advice. Tiger Research does not guarantee the accuracy, completeness, or timeliness of this report and is not responsible for any losses or damages resulting from its use. All disclaimers, risk warnings, and conflict of interest disclosures in the original Kaiko document also apply to this report.


