

Key Takeaways
Macro remains supportive despite slower pace: Global M2 hit an all-time high of $134.4T, and ETF flows turned net positive for the first time in 14 months. However, the Iran-driven oil shock pushed March CPI to 3.3%, narrowing the Fed’s rate-cut path.
Bitcoin on-chain indicators shifting from undervalued to early equilibrium: Key on-chain metrics have exited the Q1 fear zone. Current price of $70,500 sits approximately 13% below the long-term holder average entry of $78,000. A break above this level is the primary signal for a near-term trend reversal.
$143,000 target and 2x upside remain valid: Derived from a neutral base of $132,500, adjusted by -10% for fundamentals and +20% for macro. Revised down from the Q1 target of $185,500, but the larger spot correction means upside from current levels has actually widened.
Macro Tailwinds Persist, but Momentum Has Slowed
Bitcoin has fallen approximately 27% since the Q1 report, trading near an average of $70,500 in early April. The Iran conflict introduced a new variable, but the broader macro environment remains favorable. What has changed is not the direction, but the speed.
Liquidity at Record Highs, but Not Reaching Bitcoin
Global M2 continues to expand near an all-time high of $134T as of February 2026. Yet Bitcoin has fallen 27% from Q1. Liquidity and price are moving in opposite directions.
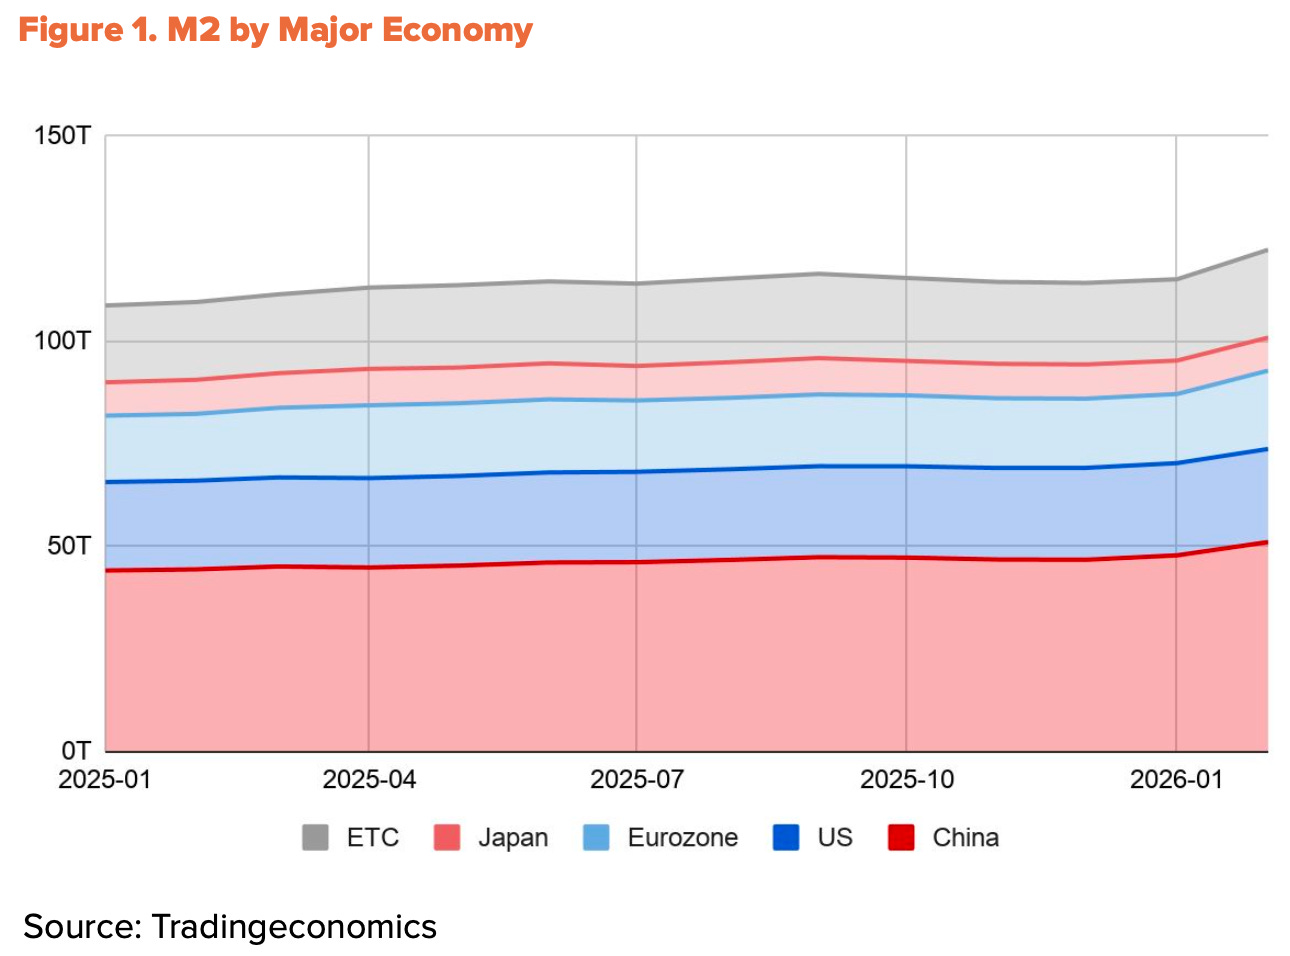
The source of liquidity explains the divergence. Of the M2 growth across the four major economies (China, U.S., Eurozone, Japan) over the past year, over 60% originated in China, following the PBOC’s reserve requirement cuts and formal easing stance in Q1.
The U.S. contribution was just 10%. The problem is that China-sourced liquidity has limited pathways into Bitcoin markets. Domestic crypto trading restrictions remain in place, and indirect routes through Hong Kong and Singapore operate primarily for institutional flows. Global liquidity is at a historical peak, but the share that can actually reach Bitcoin has shrunk.
Iran Conflict Slows the Fed’s Rate-Cut Path
With China-sourced liquidity largely blocked, U.S. dollar liquidity remains Bitcoin’s primary driver. But even this has been delayed by the Iran conflict.
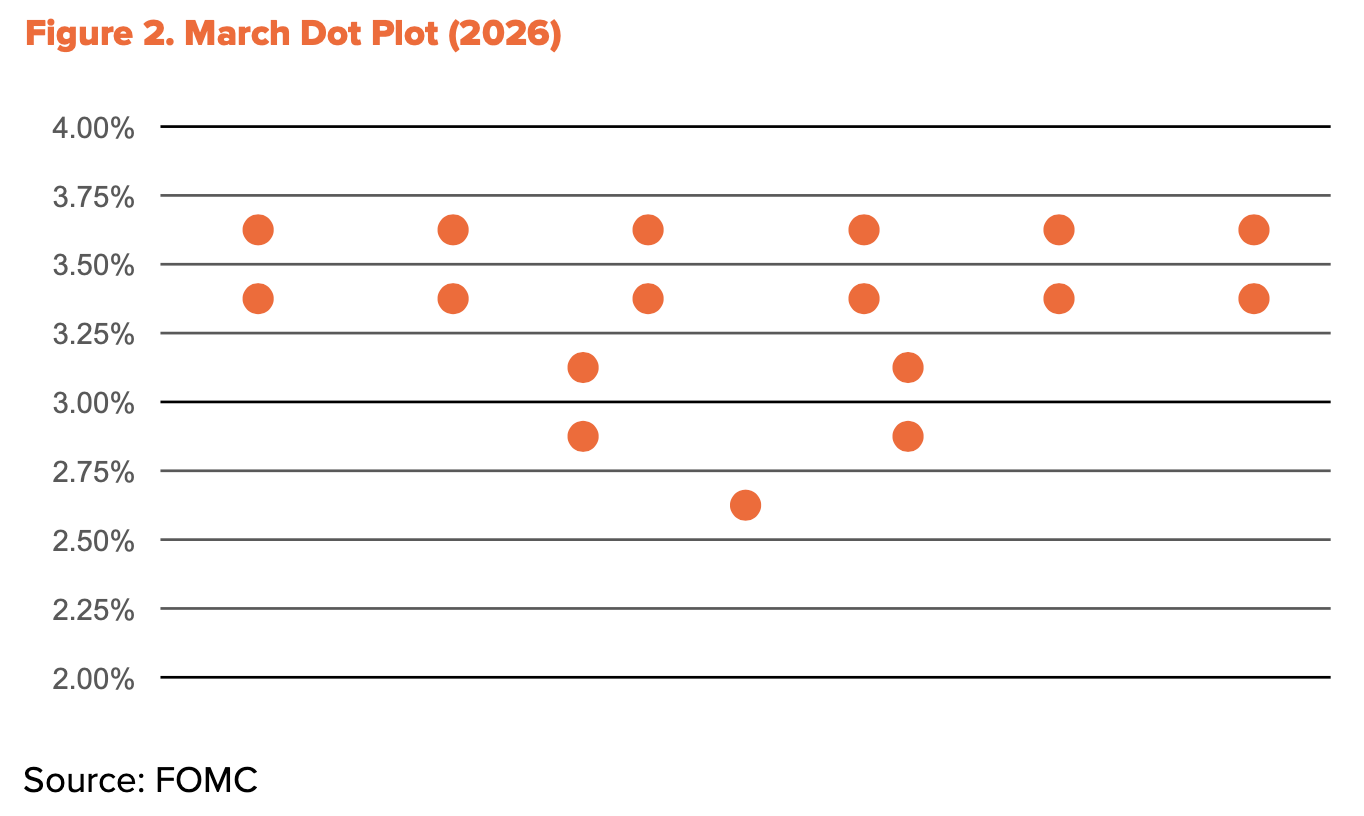
Following the U.S.-Israel strike on Iran on February 28, the Strait of Hormuz was blockaded. Brent crude surged to $118 by mid-March, and Dubai crude hit an all-time high of $166. The shock fed directly into inflation. U.S. CPI jumped from 2.4% in February to 3.3% in March, a two-year high. The Fed’s room to cut rates narrowed accordingly. The March dot plot reduced 2026 rate-cut expectations to just one.
That said, the direction of easing has not changed. By mid-April, the Strait of Hormuz partially reopened and oil prices fell sharply to around $90. Core CPI held steady at 2.6%, meaning the shock has not yet spread through the broader economy. President Trump formally nominated Kevin Warsh as the next Fed Chair in late January, and Senate confirmation hearings are ongoing. Following the end of Powell’s term on May 15, an easing bias is likely to persist. The number of cuts may be reduced, but the direction remains the same.
Institutional Flows Reverse Course
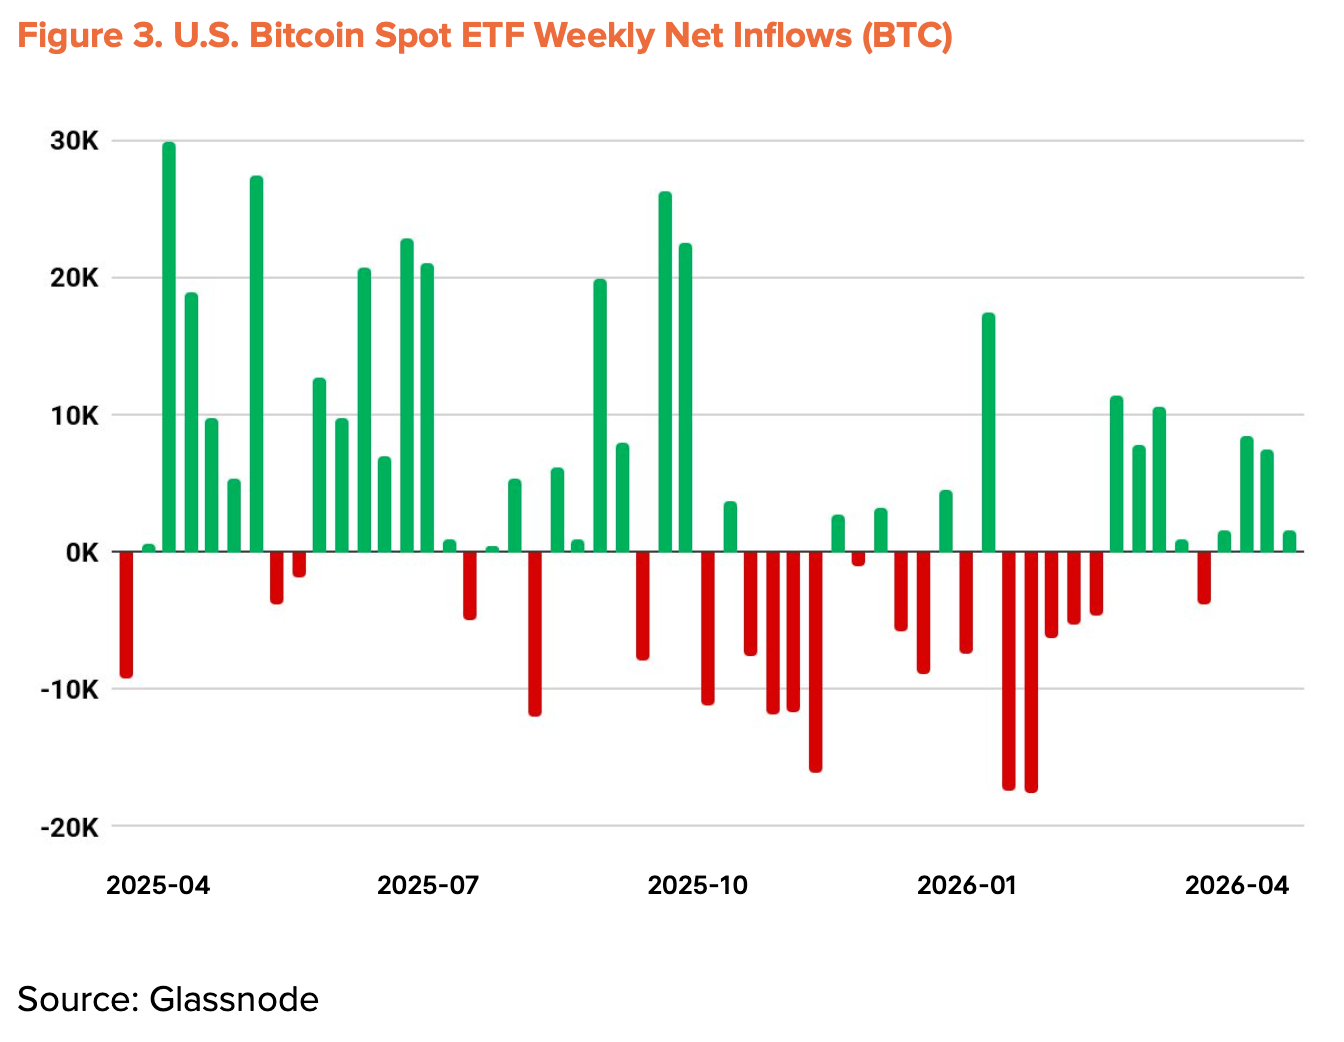
Institutional outflows that drove the Q1 decline have begun to reverse. Bitcoin spot ETFs recorded their worst monthly outflows since launching in November 2025, then remained in net outflow for five consecutive months. Since March, however, monthly net inflows have turned positive. By mid-April, year-to-date cumulative flows turned positive, with total AUM recovering to $96.5B.
Corporate accumulation is also accelerating. Strategy purchased 34,164 BTC for $2.54B in a single week (April 13-19), bringing total holdings to 815,061 BTC. Note, however, that the number of companies participating in this trend has not grown significantly.
Macro Indicators Revised Down to +20%
Structural tailwinds remain intact: liquidity expansion, a policy easing bias, renewed institutional inflows, and progress on the U.S. CLARITY Act. Near-term headwinds from the Iran-driven oil shock and slower Fed rate cuts partially offset these gains. The Q2 Macro Indicators adjustment is revised down 5% from Q1 to +20%.
From Undervalued to Early Equilibrium
On-chain indicators have moved out of extreme fear and are transitioning toward the boundary between undervalued and equilibrium. Key metrics including MVRV-Z, NUPL, and aSOPR have cleared the Q1 fear zone and entered early recovery. Sharp rallies like those seen during fear-zone bounces are unlikely, but the historical one-year average return from this zone has consistently remained in double digits. Risk-reward remains most favorable here.
Notably, the short-term holder (STH) average cost basis has been declining gradually. This signals that speculative capital is exiting while new buyers accumulate at lower levels. The timing aligns with the resumption of ETF net inflows and Strategy’s large-scale purchases, supporting the view that institutional buyers have been accumulating at a discount and pulling the average entry price lower.
The critical risk level is $54,000, the average cost basis. A break below this threshold would push the entire network into unrealized loss, making it an extreme-scenario floor. The strongest resistance sits at $78,000, overlapping with the long-term holder average entry price.
At $70,500, current price is approximately 13% below this level, with a large portion of recently entered short-term capital sitting at unrealized losses. A decisive break above $78,000 in the near term warrants close attention.
Surface Growth, Underlying Stagnation
Daily average Bitcoin transactions in the first half of April reached 564,000, up 37.9% year-over-year. The headline looks strong, but the details tell a different story.
Active addresses fell to 428,000 over the same period, down 13.2% year-over-year and 4.2% quarter-over-quarter. Average transfer size per transaction declined to 1.19 BTC, down 34.1% from 1.80 BTC in the prior quarter. Transaction count rose while participants and per-transaction value both fell. The pattern reflects a small number of users moving small amounts repeatedly, not broader economic utilization of the network. A significant portion of the increase is likely attributable to mechanical flows such as exchange deposits, unrelated to genuine growth.
The Q1 report held the Fundamental Indicator at 0% on the expectation of BTCFi ecosystem expansion. In Q2, that thesis has weakened. According to The Block’s 2026 Digital Asset Outlook, Bitcoin L2 TVL has fallen 74% year-to-date, and total BTCFi TVL is down 10%, representing just 0.46% of total BTC supply (91,332 BTC). Individual protocols such as Babylon and Lombard show selective growth, but the ecosystem as a whole has contracted.
Fundamental Indicator Revised Down to -10%
Surface-level growth has not translated into real network expansion, and the data underlying the BTCFi thesis has weakened. The offsetting balance between positive and negative signals that justified a 0% adjustment in Q1 has broken down. The Fundamental Indicator is revised down from 0% to the floor of -10% for Q2.
Target $143,000, 2x Upside
Applying the TVM methodology to the early April 2026 average price yields a neutral base of $132,500. With a Fundamental Indicator adjustment of -10% and a Macro Indicator adjustment of +20%, the 12-month target price is set at $143,000.
The figure is approximately 23% below the Q1 target of $185,500. However, actual upside potential has expanded. On an average-price basis, upside has widened from +93% in Q1 to +103% in Q2.
A lower target does not signal pessimism. Both macro direction and on-chain structure continue to support a medium-to-long-term bull case.
Three near-term checkpoints: 1) a decisive break above the network mid-term equilibrium of $78,000, 2) sustained ETF inflows, and 3) a Fed policy shift following geopolitical risk reduction. If these three conditions align, $143,000 remains an achievable target.
🐯 More from Tiger Research
Read more reports related to this research.Disclaimer
The Bitcoin valuation methodology presented in this document (hereinafter referred to as the “Methodology”) is intended solely for educational and academic research purposes. It does not constitute investment advice, a solicitation to buy or sell, or a recommendation to engage in any form of trading activity. The fair prices derived from this Methodology are theoretical outputs based on objective data and mathematical models. They should not be interpreted as guidance or endorsement for any specific investment action, including buying, selling, or holding Bitcoin.
This Methodology is designed as a research framework to offer one perspective on Bitcoin valuation. It is not intended to be used as the basis for actual investment decisions. The Methodology has been carefully reviewed to ensure it does not constitute any form of market manipulation, fraudulent trading, or other unfair trading practices as defined under Article 10 of the “Act on the Protection of Virtual Asset Users” (the “Virtual Asset User Protection Act”). All analysis uses only publicly available information, including on-chain blockchain data and officially released economic indicators. No material non-public or insider information has been used. All valuation outputs, including target prices, are based on reasonable assumptions and presented without misrepresentation or omission of material facts.
The authors and distributors of this Methodology fully comply with the conflict of interest disclosure requirements set forth in Article 10, Paragraph 4, Item 2 of the Virtual Asset User Protection Act. If the authors hold or intend to trade the relevant virtual asset (Bitcoin) at the time of writing or distribution, such interests will be transparently disclosed.
The indicators used in this Methodology—such as Base Price, Fundamental Indicator, and Macro Indicator—are derived from approaches the authors consider reasonable. However, they do not represent absolute truths or definitive answers. The Bitcoin market is highly volatile, operates 24/7, spans global jurisdictions, and is subject to significant regulatory uncertainty. As a result, there may be substantial and prolonged deviations between the valuation results of this Methodology and actual market prices.
This Methodology is based on historical data and information available at the time of writing. It does not guarantee or predict future performance. Past patterns or correlations may not persist, and unexpected market shocks, regulatory shifts, technical failures, or macroeconomic events could significantly undermine the predictive validity of this framework. Given the relatively short history and evolving nature of the crypto market, there are inherent limitations to the reliability of past data and its applicability to future projections.
All investment decisions should be made independently and under the investor’s sole responsibility. This Methodology should not serve as the sole or primary basis for any investment decision. Investors must carefully consider their financial situation, investment objectives, risk tolerance, and experience, and should seek independent financial or investment advice as needed. The authors, distributors, and any related parties bear no responsibility for any direct, indirect, consequential, special, or punitive losses or damages arising from investment decisions made with reference to this Methodology.
Terms of Usage
Tiger Research allows the fair use of its reports. ‘Fair use’ is a principle that broadly permits the use of specific content for public interest purposes, as long as it doesn’t harm the commercial value of the material. If the use aligns with the purpose of fair use, the reports can be utilized without prior permission. However, when citing Tiger Research’s reports, it is mandatory to 1) clearly state ‘Tiger Research’ as the source, 2) include the Tiger Research logo. If the material is to be restructured and published, separate negotiations are required. Unauthorized use of the reports may result in legal action.


