
This report is written by Tiger Research and presents the Tiger Valuation Model (TVM), a systematic evaluation framework for calculating Bitcoin's fair price. We combine market sentiment indicators, network fundamentals, and macroeconomic indicators to determine Bitcoin's fair value.
1. Introduction
Every asset carries a price. Even a single apple on a supermarket shelf may seem expensive to one person and cheap to another. These differences in perception arise because individuals rely on their own internal benchmarks to judge value. When something is perceived as cheap, we tend to buy more; when it seems expensive, we hold off or sell.
"What is the fair value of Bitcoin?"
This is a question virtually every crypto investor has asked—retail and institutional alike. Some turn to technical chart patterns, others react to headlines, and some rely on gut feeling.
In traditional equity markets, valuation is supported by standardized metrics and models. Analysts use indicators like P/E ratios, P/S ratios, and EV/EBITDA, as well as models such as dividend discount (DDM) or discounted cash flow (DCF) to derive price targets. Investors use these frameworks to assess fair value and guide decision-making.
Bitcoin, by contrast, lacks a widely accepted valuation framework. There has been no consensus on which data to use or how to interpret it. Some compare Bitcoin to gold or speculate that it could absorb part of global capital markets—approaches that remain theoretical and hard to apply in practice.
“Fifteen years after Bitcoin's creation, is it still impossible to estimate its fair value?”
The market reality has changed. Bitcoin now exceeds $2 trillion in market capitalization and has become an established asset class. Institutional investors are entering in growing numbers, increasing its correlation with traditional financial markets. Volatility, once driven by retail speculation, has calmed down.
Bitcoin is no longer an immature asset. On-chain data allows for real-time visibility into transaction volumes, wallet activity, and long-term holder behavior—including what they paid. Network activity can be monitored with transparency that often exceeds that of traditional financial assets.
In response to these fundamental shifts, Tiger Research introduces a systematic valuation framework for Bitcoin.
The key is to reflect Bitcoin's unique characteristics. Rather than force-fitting models used for equities or gold, our framework uses on-chain data, and institutional behavior to estimate value. The result is an objective reference point that can be used by both retail and institutional participants. The goal is to enable more rational, evidence-based investment decisions—moving beyond emotional reactions driven by FOMO or FUD.
2. Tiger Valuation Model (TVM)
Tiger Research's Tiger Valuation Model (TVM) is a framework designed to estimate Bitcoin's fair price. The core objective of TVM is to assess the multiple factors that influence Bitcoin's price in an integrated manner. This approach mirrors how equity analysts evaluate companies using disclosures, fundamentals, and broader economic conditions.
Unlike other methods that rely solely on on-chain data or macroeconomic trends, TVM combines both to provide a more complete and accurate estimate of Bitcoin's fair value.
The goal is to offer investors a more objective and reliable reference point for valuation.
2.1. TVM Formula
Fair Price = Base Price × Fundamental Indicator Multiplier × Macro Indicator Multiplier
TVM takes a step-by-step approach to figure out Bitcoin's fair price. It's a 3-step method that looks at market sentiment, network fundamental, and the macroeconomic environment one after another.
The first step uses on-chain data to evaluate investor sentiment and identify overbought or oversold conditions. It estimates a sentiment-neutral base price by filtering out extreme emotions in the market.
The second step measures underlying value based on Bitcoin network activity. Since 2024, the BTCFi ecosystem has started growing seriously, and Bitcoin network activity has been gradually increasing. TVM captures this shift by analyzing network activity changes to adjust the Base Price.
The final step incorporates broader economic factors, including global liquidity, institutional capital flows, and regulatory developments. These variables are combined into a macro multiplier applied to the adjusted base price.
A core feature of the TVM approach is the interaction effect among these components. Each factor independently influences price, but in combination, they can amplify outcomes. For example, if macro conditions improve and institutional money flows in while user growth also rises, the combined impact may exceed the sum of the parts. Conversely, stagnating user adoption amid tightening liquidity can lead to outsized downside risk.
This amplification dynamic has been observable in recent market cycles. During the 2020 pandemic, even modest improvements in fundamentals triggered major price rallies due to expansive monetary conditions. In contrast, in 2022, network health remained stable, but broad market contraction led to sharp price declines.
TVM accounts for these dynamics by sequentially applying multipliers—derived from network and macro indicators—to a sentiment-adjusted base price.
We believe TVM's structured approach offers a clearer explanation of Bitcoin's complex price formation process than conventional methods. By integrating diverse market signals, it provides investors with a more practical and transparent framework for valuation.
2.2. Detailed Framework of TVM
Step 1: Deriving the Base Price
The first step in the TVMis to assess whether Bitcoin's current price is in an overbought or oversold range and to extract a sentiment-neutral fair value. This involves removing the influence of market emotions—such as fear and greed—to establish a baseline.
This concept aligns with the equity market saying: "Stock prices are like a dog on a leash"—short-term volatility (the dog) diverging from long-term value (the owner). Similarly, in the Bitcoin market, we believe that while sentiment may drive short-term price swings, long-term prices tend to converge toward intrinsic value. The Base Price represents a neutral fair value that filters out emotional extremes using on-chain data.
To estimate this, we apply three widely used on-chain indicators: MVRV-Z Score, aSOPR, and NUPL. These metrics rely on unchangeable blockchain data to evaluate market sentiment. We analyzed the past four years of each metric and quantified their forward-looking return profiles by measuring how price changed after a given signal appeared. For example, we tracked the average return following periods when the MVRV-Z Score entered deep undervaluation zones.
Each indicator's output was then converted into expected returns and combined to construct the Base Price. We applied weighted averages: 50% to MVRV-Z, 30% to aSOPR, and 20% to NUPL. The result is a sentiment-adjusted fair value used as the foundation for subsequent adjustments.
Step 2: Applying the Fundamental Multiplier
The Base Price reflects market neutrality but does not capture Bitcoin's real value. Unlike traditional assets, Bitcoin has no cash flows and cannot be valued using standard models like DCF. Nor does it fully align with the characteristics of a safe-haven asset like gold.
Therefore, we define Bitcoin's real value as a function of its decentralized network—a system not controlled by any central authority. The value of this network comes from user participation and activity, similar to Metcalfe's Law: as user engagement increases, network usefulness and long-term value rise. On the flip side, declining activity can reduce perceived value. Recently, the BTCFi ecosystem has emerged and expanded Bitcoin's use cases, which makes network activity analysis even more important.
To measure network fundamentals, we use three core metrics:
Transaction count – frequency of network use
Transfer volume – scale of economic activity
Number of active and new addresses – network growth and user adoption
These metrics reflect how actively the network is being used and help measure Bitcoin's fundamental value.
Each indicator is compared against its historical average to create a Fundamental Multiplier. If current activity is above average, the multiplier goes up; if below, it goes down. This adjustment is applied to the Base Price to account for network dynamics and serves as the input for the final step.
However, we need to recognize that these indicators don't significantly influence price yet. Bitcoin still functions primarily as an investment asset like gold, and the BTCFi ecosystem is still in early stages. While network activity indicators are theoretically sound, they don't drive actual price much. But we expect these fundamental indicators will gain increasing influence as BTCFi expands its reach and Bitcoin's network delivers greater utility.
Step 3: Incorporating the Macro Indicator
The final step integrates macroeconomic factors. As Bitcoin has evolved into a globally traded financial asset, its price is increasingly influenced by external conditions. Regardless of its underlying fundamentals, macro shifts can cause significant price movements.
For example, during the COVID-19 pandemic in 2020, global liquidity surged, and Bitcoin rose sixfold—from $10,000 to $60,000. In contrast, when the U.S. Federal Reserve tightened policy in 2022, Bitcoin fell below $20,000, despite stable fundamentals. These episodes show Bitcoin's high sensitivity to macro conditions. Its correlation with gold varies over time, making it difficult to classify definitively as either a risk or safe-haven asset.
The link between Bitcoin and global markets was further strengthened by the SEC's approval of spot Bitcoin ETFs in 2024, which accelerated institutional capital inflows. Firms like BlackRock and Fidelity channeled large amounts into Bitcoin via ETFs, with total assets reaching $135 billion, helping to push Bitcoin above $100,000. Listed firms such as Strategy also played a role through large-scale accumulation. These developments are closely tied to regulatory trends, particularly in the U.S., and future inflows will likely depend on evolving policy frameworks.
To quantify these macro factors, TVM uses three key indicators:
Global liquidity (M2) – total money supply from central banks in major economies (U.S., EU, China, Japan, Korea)
Institutional flows – real-time monitoring of ETF fund inflows/outflows to gauge institutional sentiment
Regulatory environment – qualitative assessment of whether government policy is supportive or hostile to Bitcoin
Each factor is compared against historical norms to generate a Macro Multiplier, which is applied to the price adjusted by the Fundamental Multiplier. The final output is the 12-month forward Fair Price.
2.3. Safeguards Against Extreme Volatility and Noise
To prevent overreaction to short-term shocks, the Tiger Valuation Model (TVM) applies caps on adjustment multipliers. This is designed to filter out excessive noise and maintain valuation stability. Specifically, the Fundamental Multiplier is capped at ±10%, while the Macro Multiplier is limited to ±40%.
For example, even with highly positive network developments, the fundamental adjustment cannot exceed +10%. Similarly, even under severe macro shocks—such as a global financial crisis—the macro adjustment will not reduce the valuation by more than 40%.
This constraint exists for a simple reason: most market-moving news creates temporary disruptions rather than fundamental shifts. Bitcoin may drop 20% on a regulatory comment or surge 10% on a celebrity tweet, yet these do not change its underlying value. The TVM framework is designed to screen out this noise and focus on long-term, rational valuation ranges.
2.4. Case Study: November 2022
Now that we've reviewed the core of the TVM, let's examine how it can be applied in real market scenarios. We will analyze the practical application process through a representative case study.
In November 2022, when Bitcoin was trading near $20,000, the FTX bankruptcy crisis erupted. The entire crypto market fell into panic. Let's use the TVMto estimate a fair value under these conditions.
We start by setting the base price. The MVRV-Z score dropped below zero, while aSOPR and NUPL also entered fear zones. Generally, when the MVRV-Z score falls below zero, it means the current price is below the average purchase price of market participants. This indicates the market has reached extreme fear and that additional selling pressure is likely to be limited. Based on historical data, similar conditions typically provide around 10% rebound potential, setting the base price at $22,000.
Looking at fundamental indicators from this starting point, we find something interesting. After FTX collapsed, people lost trust in centralized exchanges and Bitcoin network activity actually went up temporarily. Users moved their assets from exchanges to personal wallets, which boosted transaction counts, transfer volumes, and active wallet numbers slightly. While limited, this network activity increase showed that people still trusted the Bitcoin network itself. We see this as a positive fundamental factor, so we apply a 5% upward adjustment. We take our base price of $22,000 and add the 5% fundamental adjustment to get $23,100.
In macro terms, global M2 growth was slowing, reducing market liquidity. China's property crisis was adding risk to global macro indicators. Additionally, the FTX collapse was not just a single-entity failure but triggered broader distrust toward the crypto ecosystem. Without clear regulatory frameworks from major countries, institutional participation remained limited. Taking these combined factors into account, a 30% downward adjustment was forecasted.
Interestingly, extreme fear often creates conditions for a strong rebound. When MVRV-Z hits deep negative territory, this price zone often attracts accumulation by long-term investors. We see these bottoms, formed in extreme environments, often become solid support levels. If macro conditions improve or regulatory uncertainty eases, we expect a sharp recovery to follow.
Fair Price= Base Price × Fundamental Indicator Multiplier × Macro Indicator Multiplier
$16,170 = $22,000 × 1.05 × 0.70
Base Price: $22,000 (based on MVRV-Z < 0, with 10% adjustment applied)
Network Fundamental Multiplier: 1.05 (network activity increase, personal wallet transfers increase)
Macro Indicator Multiplier: 0.70 (FTX collapse, global M2 contraction, regulatory uncertainty)
Fair Price Valuation: $22,000 × 1.05 × 0.70 = $16,170
Now let's compare this prediction with actual results. In December 2022, Bitcoin's price dropped to $15,000. Our TVM calculation of $16,170 was only about 7% off—pretty accurate. After the price drop, on-chain data showed extreme fear conditions, and fundamental indicators showed network trust was holding up. This suggested medium-term rebound potential. Starting in late 2022, Bitcoin ETF approval expectations grew, which increased the chance of institutional investors entering the market. Geopolitical uncertainty like the Russia-Ukraine war also boosted interest in Bitcoin's role as "digital gold." As these macro conditions improved, the rebound that on-chain data predicted began.
From March 2023 onward, macro conditions began to improve more substantially. The U.S. Federal Reserve slowed the pace of rate hikes, which helped restore risk appetite, and the end of China’s zero-COVID policy boosted global economic recovery expectations. As a result, Bitcoin surpassed $40,000 by year-end, marking a 166% increase.
This case clearly illustrates the strengths of the TVM framework. Rather than relying on technical patterns or emotional judgment, it combines on-chain data, fundamentals, and macro variables to produce an objective fair value estimate. More importantly, it preemptively outlined the potential for a rebound under extreme conditions—providing investors with a structured framework for making rational decisions.
3. Base Price Derivation
The reason the TVMuses MVRV-Z Score, NUPL, and aSOPR to calculate the base price is straightforward: all three are based on actual transaction data recorded on the blockchain. It is fully transparent—showing when Bitcoin was bought, at what price, whether it was sold, and how much is currently held.
This kind of objective data is important because it provides a logical starting point for analysis, free from emotional reactions. For instance, if the average purchase price of all investors is $50,000 and the current price is $80,000, most participants are sitting on a 60% unrealized gain.
This could signal increased motivation to take profits, adding sell pressure to the market. But this is just one piece of the puzzle—we need multiple angles to get the complete picture. Each of these three key indicators captures a different but complementary dimension of market structure:
The first indicator measures how high or low the current price is relative to past norms.
The second shows how much profit the overall market is currently sitting on.
The third tracks whether recent sellers made gains or losses.
Taken together, these three perspectives allow for a complete view of market conditions. It's similar to how a doctor checks blood pressure, temperature, and heart rate to assess a patient's health. One data point alone is not enough, but the combination leads to a clearer picture.
Global investment firms also use these indicators. In its 2024 official report, Grayscale highlighted MVRV-Z and NUPL as core analytical tools. Glassnode, a leading on-chain analytics firm, has called MVRV-Z "the most accurate indicator for identifying market tops and bottoms.
3.1. Breakdown of Key Price Sentiment Indicators
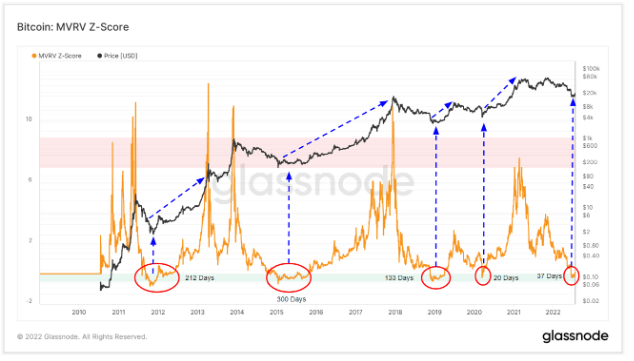
3.1.1. MVRV-Z Score: A Snapshot of Market-Wide Profitability
Realized Cap: The total value of all Bitcoins based on the last price at which each coin moved
MVRV Ratio = Market Cap ÷ Realized Cap
MVRV-Z Score = (MVRV Ratio − Historical Average) ÷ Standard Deviation
The MVRV-Z Score statistically normalizes the ratio of market value to realized value to show where the current price level sits historically.
Let's start with the basic concept. Realized cap is the sum of the prices at which all Bitcoins were last transacted—basically the average purchase cost across the market. The MVRV Ratio divides current market cap by this value to show how far the current price has moved from the average cost basis.
The MVRV-Z Score goes a step further by subtracting the historical average of the MVRV Ratio and dividing by its standard deviation. This normalization allows for objective comparison across different market cycles, highlighting how statistically extreme current valuations are.
How is this used in practice? Historically, MVRV-Z values above 7 have matched up with market tops. Values below −0.5 have typically signaled good entry points. By checking the unrealized profit across the network, this indicator helps determine whether the market is overheated or beaten down.
3.1.2. NUPL: Measuring the Network's Unrealized Profit and Loss
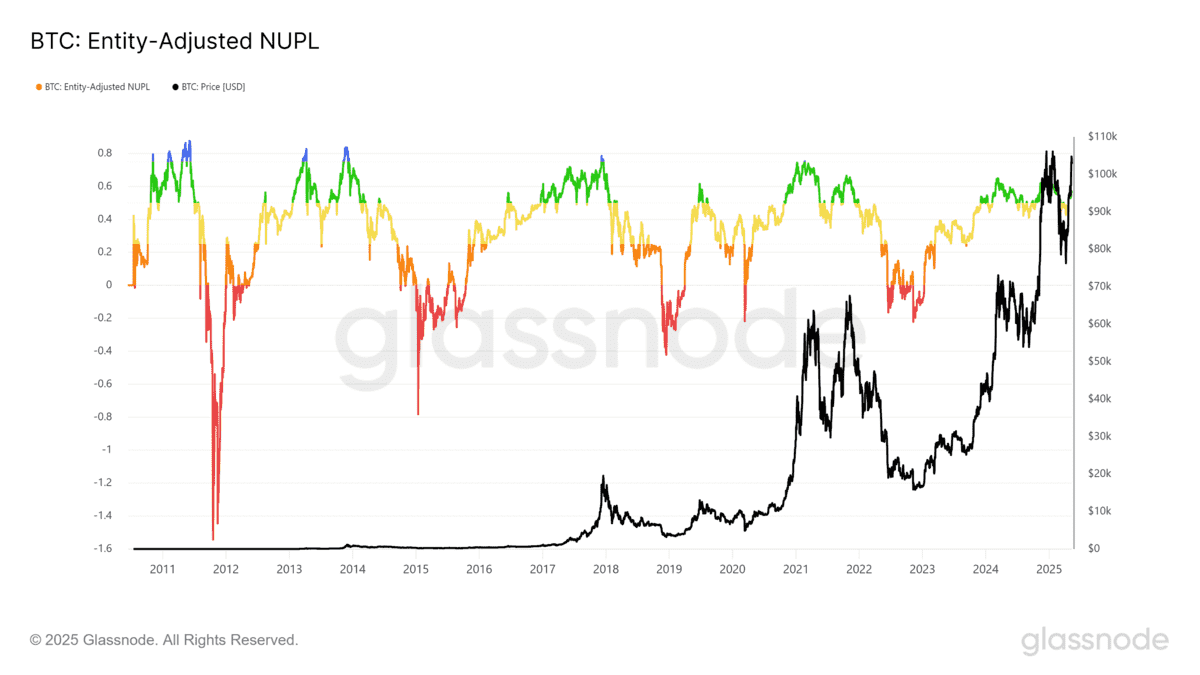
NUPL = (Market Cap − Realized Cap) ÷ Market Cap
NUPL (Net Unrealized Profit/Loss) shows the total unrealized gains or losses of all market participants as a single number. It clearly shows whether investors, on average, are in profit or loss.
The formula is simple: subtract the realized cap from the market cap and divide by the market cap. A positive NUPL value means most holders are in profit; a negative value shows widespread unrealized losses.
This number has big implications for investor behavior. When NUPL goes above 0.7, the majority of participants are sitting on large gains, increasing the chances of profit-taking. In such cases, further price upside may be limited, and a more careful stance is needed.
On the flip side, when NUPL stays negative, it shows that the majority of investors are underwater—often linked with market bottoms. In this situation, further downside may be limited, and the focus should shift toward recovery potential. NUPL is a powerful tool for predicting shifts in market sentiment based on overall investor psychology.
3.1.3. aSOPR: Tracking Real-Time Behavior of Active Sellers
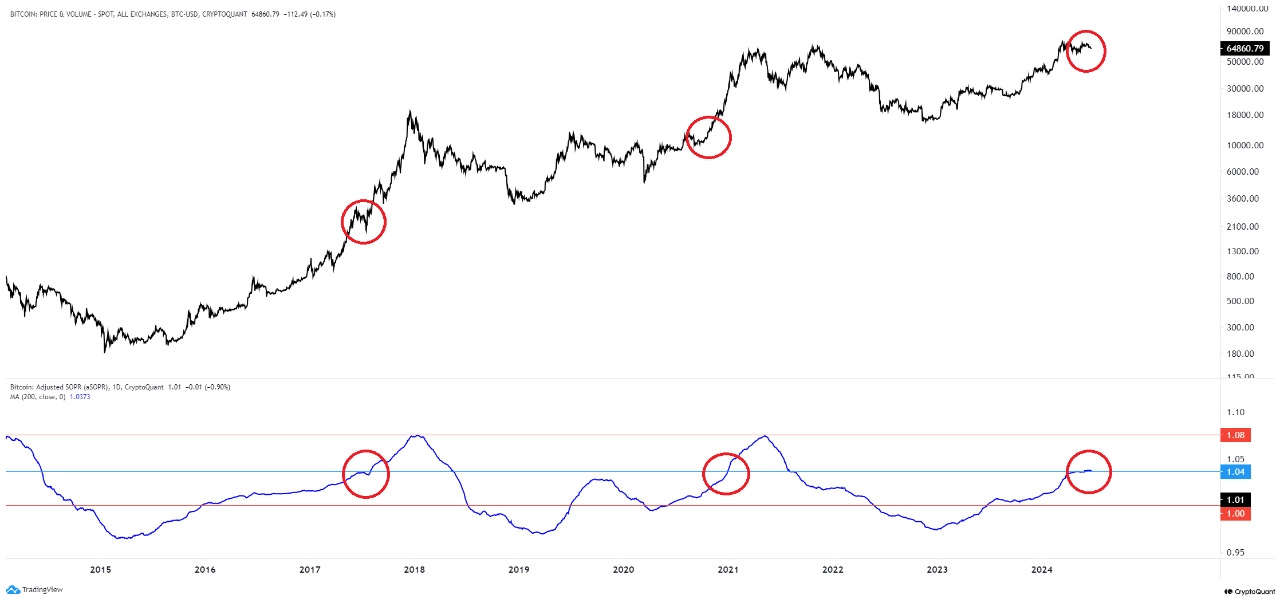
SOPR = Realized Value of Spent Outputs ÷ Cost Basis of Spent Outputs
aSOPR = SOPR excluding outputs spent within 1 hour
aSOPR (adjusted Spent Output Profit Ratio) measures the profitability of coins that are actively being spent—offering real-time insight into investor behavior. Unlike numbers based on holdings, this one shows actual transactions, making it especially useful for spotting short-term sentiment shifts.
While SOPR tracks the profit/loss ratio of all coins sold, aSOPR filters out intra-hour transactions to remove noise and focus on economically meaningful transfers.
The key threshold is 1.0:
When aSOPR > 1.0, sellers are making profits.
When aSOPR < 1.0, sellers are taking losses.
This is where investor psychology plays a critical role. Most participants hate realizing losses, so a sustained drop below 1.0 often shows capitulation. Watching how aSOPR behaves around the 1.0 level reveals where market participants face psychological resistance.
A consistent reading above 1.0 suggests a healthy uptrend.
Persistent values below 1.0 may indicate selling exhaustion and potential for reversal.
3.2. Data Construction and Analysis Process
3.2.1. Analytical Methodology
A structured data analysis process is essential to objectively estimate Bitcoin's fair value. This methodology is built on a practical model that matches on-chain indicator levels at specific points in time with actual price outcomes 12 months later, across multiple market cycles. The analysis covers a full cycle—from the 2021 bull market peak, through the 2022 downturn, the 2023 recovery, and the 2024 ETF approval—ensuring complete coverage of how key on-chain indicators responded to major market events.
Each period was carefully reviewed based on historical context to break up the data. For each segment, 12-month forward return patterns were measured and tested for statistical significance, leading to classification into five groups.
Each indicator was then grouped into five categories: 1) Extreme fear zone, 2) Undervalued zone, 3) Neutral zone, 4) Overheating zone, 5) Extreme overvaluation zone Weights for final price adjustments were assigned based on each indicator's historical accuracy and reliability across different market phases. Rather than applying simple averages, we weighted each input according to its proven predictive performance.
MVRV-Z Score received the highest weight of 50% due to its track record of accurately identifying both tops and bottoms in Bitcoin's last three major cycles—capturing the peaks of 2017 and 2021 and the bottoms of 2018 and 2022. It is also widely cited as a primary indicator by major on-chain analytics services, confirming its reliability.
NUPL was given a 30% weight. While it has strong lagging characteristics that can limit price prediction, it serves as a meaningful secondary indicator that directly shows future selling pressure and market sentiment changes.
aSOPR was assigned a 20% weight. While its prediction accuracy has improved significantly recently, it remains sensitive to short-term volatility. During periods of surging transaction volume, it can be prone to noise.
Base Price = Current Price × 1 + [(MVRV-Z adjustment × 0.5) + (NUPL adjustment × 0.3) + (aSOPR adjustment × 0.2)]
The base price derived from this formula represents a logical fair price estimate based on current levels of on-chain economic activity. It is an objective projection grounded in historical data, not emotions or guessing.
The gap between the base price and the current market price reflects the degree of sentiment premium. If the market price is more than 30% above the base price, the market can be considered overheated. If it is more than 30% below, it suggests undervaluation. This gap becomes a key reference for identifying buy and sell timing.
4. Fundamental Indicator
The reason the TVM uses transaction count, transfer volume, and user activity to measure Bitcoin's network fundamentals is clear: unlike regular companies, Bitcoin doesn't make revenue or profits. So network usage becomes the main way to measure value.
Think about it like cities. To judge a city's health, you need to look at three things: how many people live there (user count), how often they move around and do business (transaction count), and how much money changes hands (transfer volume).
For example, imagine City A has 1 million people but almost no economic activity. City B has only 500,000 people but lots of movement and big transactions. City B would be seen as more alive and valuable.
Bitcoin's network works the same way. A healthy network needs the right mix of users, transaction frequency, and money flow. Lots of people with no activity is a ghost town. Big money moving around with few people means it's too centralized.
Take Singapore: it only has 6 million people, but its economic activity matches New York's. A real economic powerhouse needs to score high in all three areas. TVM measures Bitcoin's overall network health by looking at all these pieces together.
4.1. Detailed Breakdown of Fundamental Indicators
4.1.1. Transaction Count: A measure of network usage frequency
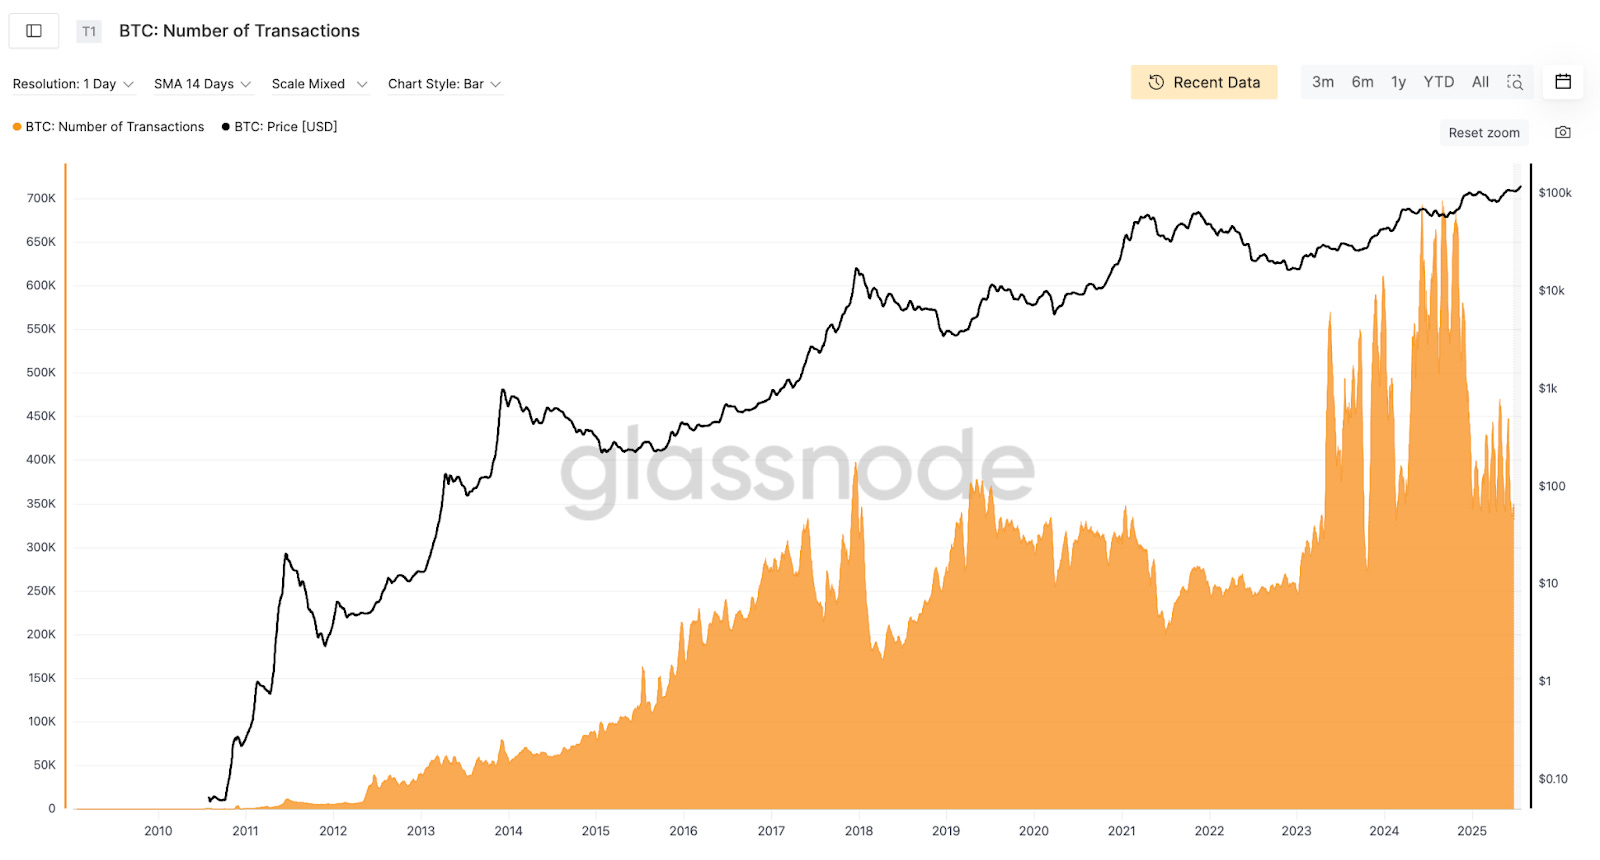
Transaction count is the most direct way to measure how often people use the Bitcoin network. Think of it like daily traffic in a city—it shows how often people actually interact with the network. A consistent rise in transaction count means more people see Bitcoin as a practical tool, and this can lead to higher Bitcoin value through network effects. On the flip side, when transaction count slows down, it means network usage is stagnating. For Bitcoin to work as a store of value, the network itself needs to stay active and secure. If usage drops, network security weakens, and this can hurt trust in Bitcoin as a store of value.
4.1.2. Transfer Volume: A measure of economic significance
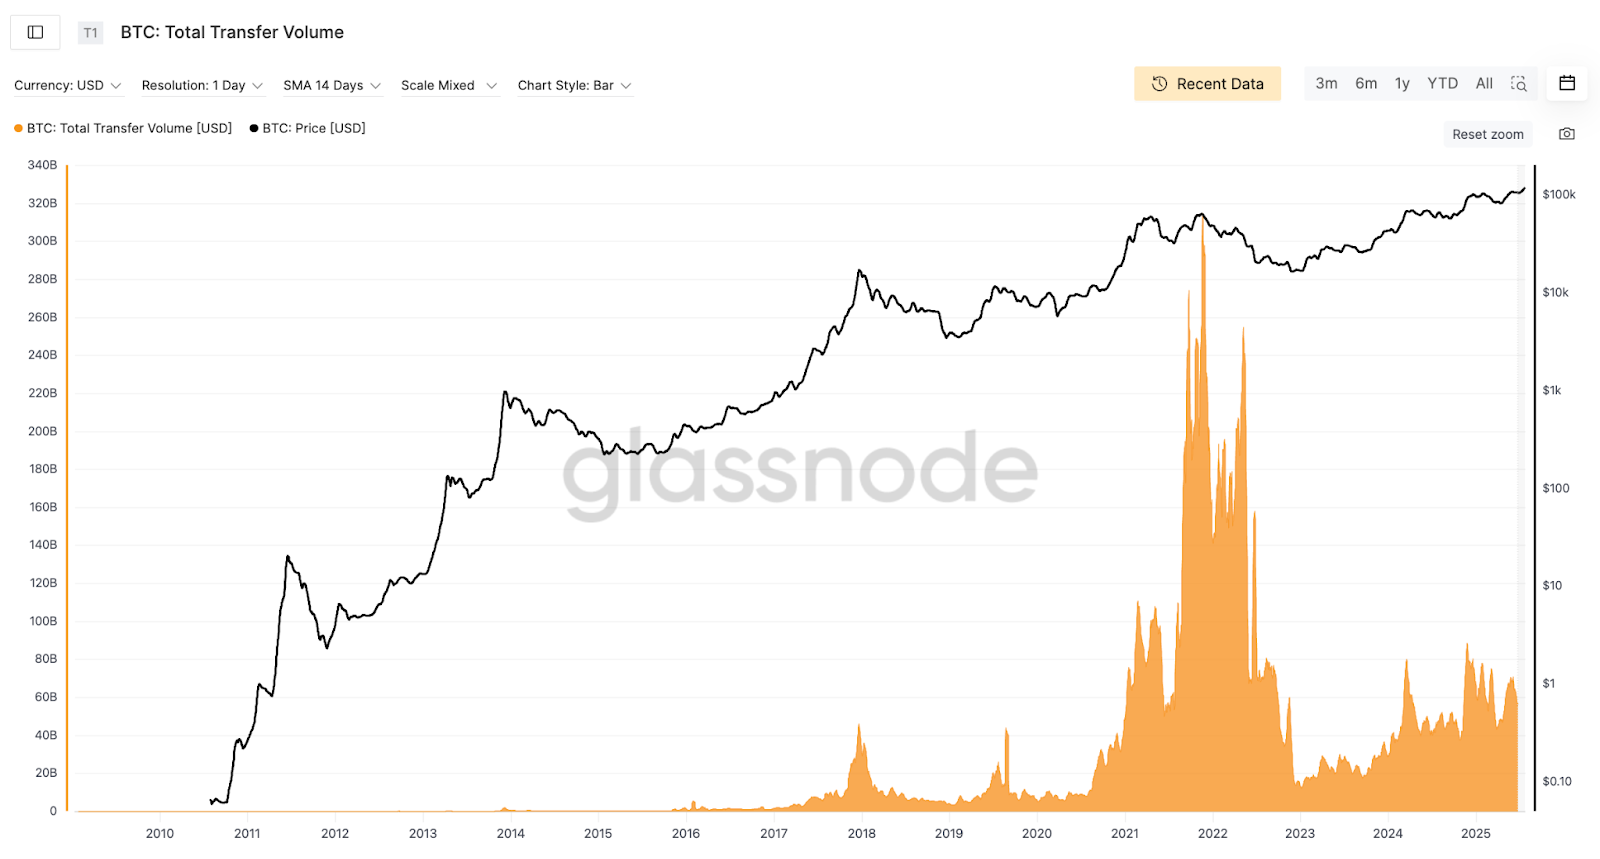
Transfer volume goes beyond simple transaction frequency to show how much Bitcoin gets used in important economic activity. It measures the real economic scale that transaction count alone can't capture.
In analysis, we separate large institutional transfers from small retail transfers. For example, 10 large institutional transfers may carry more economic weight than 1,000 small transactions. When institutional transfer volume grows, it means Bitcoin is gaining ground as an asset class among professional investors. When smaller transfers increase, it signals broader adoption among regular users.
4.1.3. Active / New User Count: A measure of network growth
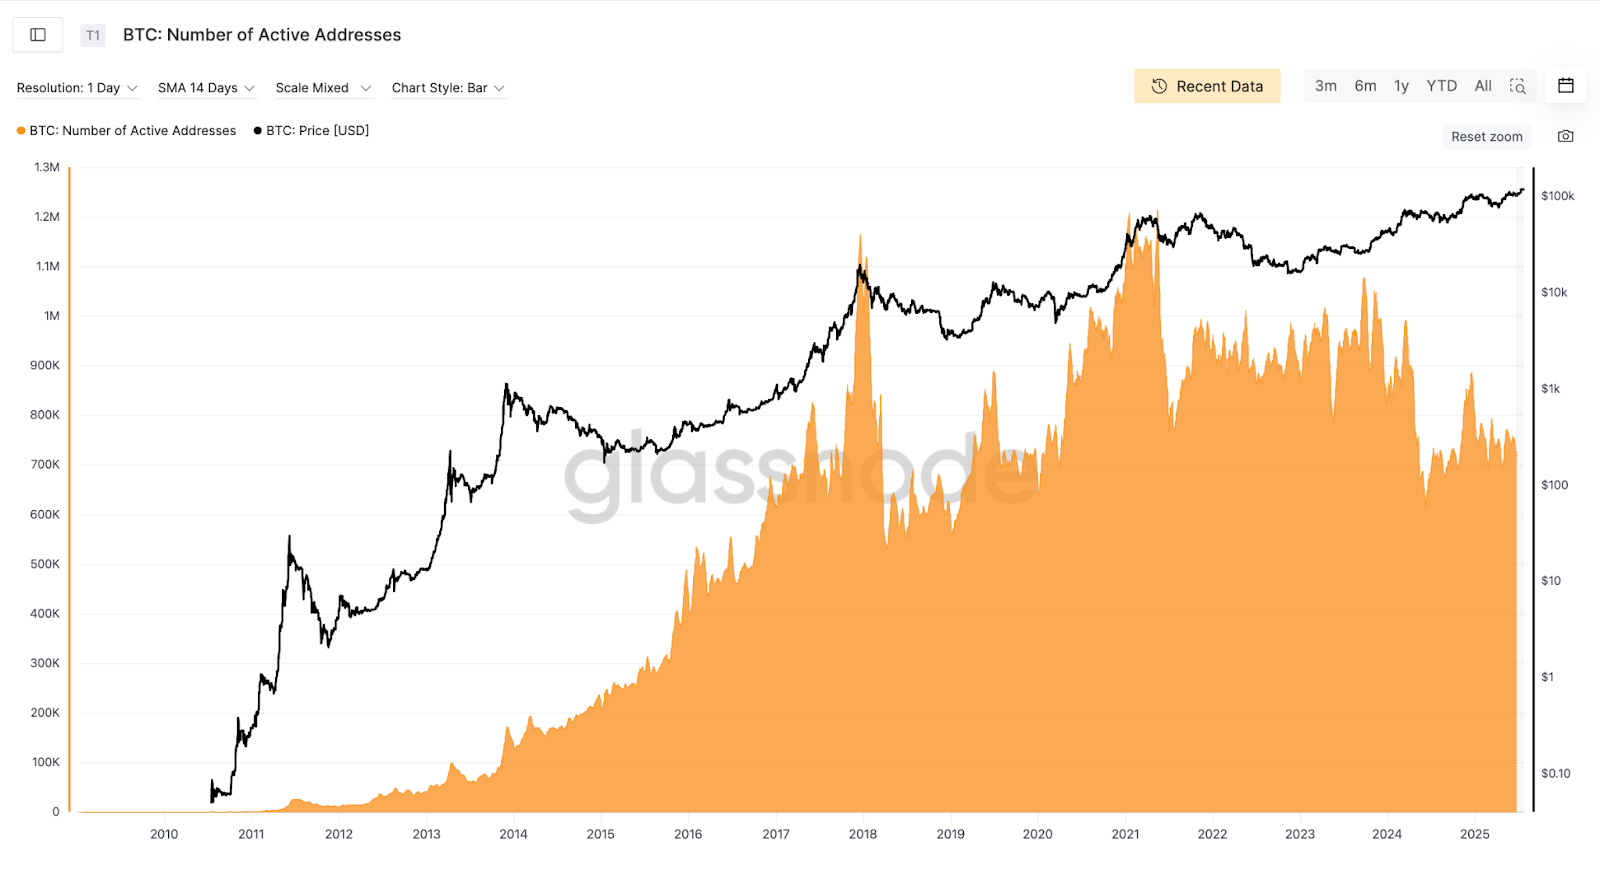
Active and new user count is a key indicator for measuring Bitcoin network growth. Active users are unique wallet addresses that actually transacted on a specific date, representing the network's economically active population. New users are first-time transacting wallet addresses among them—like a birth rate concept. These indicators matter because they serve as leading indicators that measure the network's sustainable growth. When there's a large economically active population with steady new inflows, it means the network is growing healthily, and this becomes the foundation for long-term value growth.
5. Macro Indicator
Looking at recent market trends, it is increasingly clear that Bitcoin's price volatility has become closely linked to global liquidity and macroeconomic indicators. During the COVID-19 pandemic in 2020–2021, aggressive quantitative easing by central banks injected massive liquidity into the markets, and Bitcoin surged from $10,000 to $60,000—a 6x increase. However, when the U.S. Federal Reserve switched to a tightening policy in 2022, Bitcoin immediately dropped below $20,000. This shows Bitcoin's sensitivity to changes in global liquidity.
With large-scale institutional entry via Bitcoin ETFs and ongoing regulatory alignment across major economies, macroeconomic variables from traditional financial markets are expected to have an even greater influence on Bitcoin prices going forward.
Accordingly, the macro indicator analysis in this model adopts a practical framework to derive a fair value adjustment multiplier based on three key global macroeconomic variables: 1) Global Liquidity, 2) Institutional Inflows, 3) Regulatory & Ecosystem Environment
5.1. Detailed Breakdown of Macro Indicators
5.1.1. Global Liquidity Indicator (Global M2)
Among global macro variables, the most important indicator is M2. Simply put, M2 represents the total amount of money circulating within an economy, including physical cash, checking deposits, and readily accessible savings and time deposits. It is one of the most complete measures of monetary liquidity.
When central banks pursue quantitative easing, M2 increases. When they implement tightening policies, M2 growth slows. For this model, we calculated a global M2 composite, using GDP-weighted averages of M2 from key economies that impact capital and crypto markets—namely the U.S., EU, China, Japan, and South Korea.
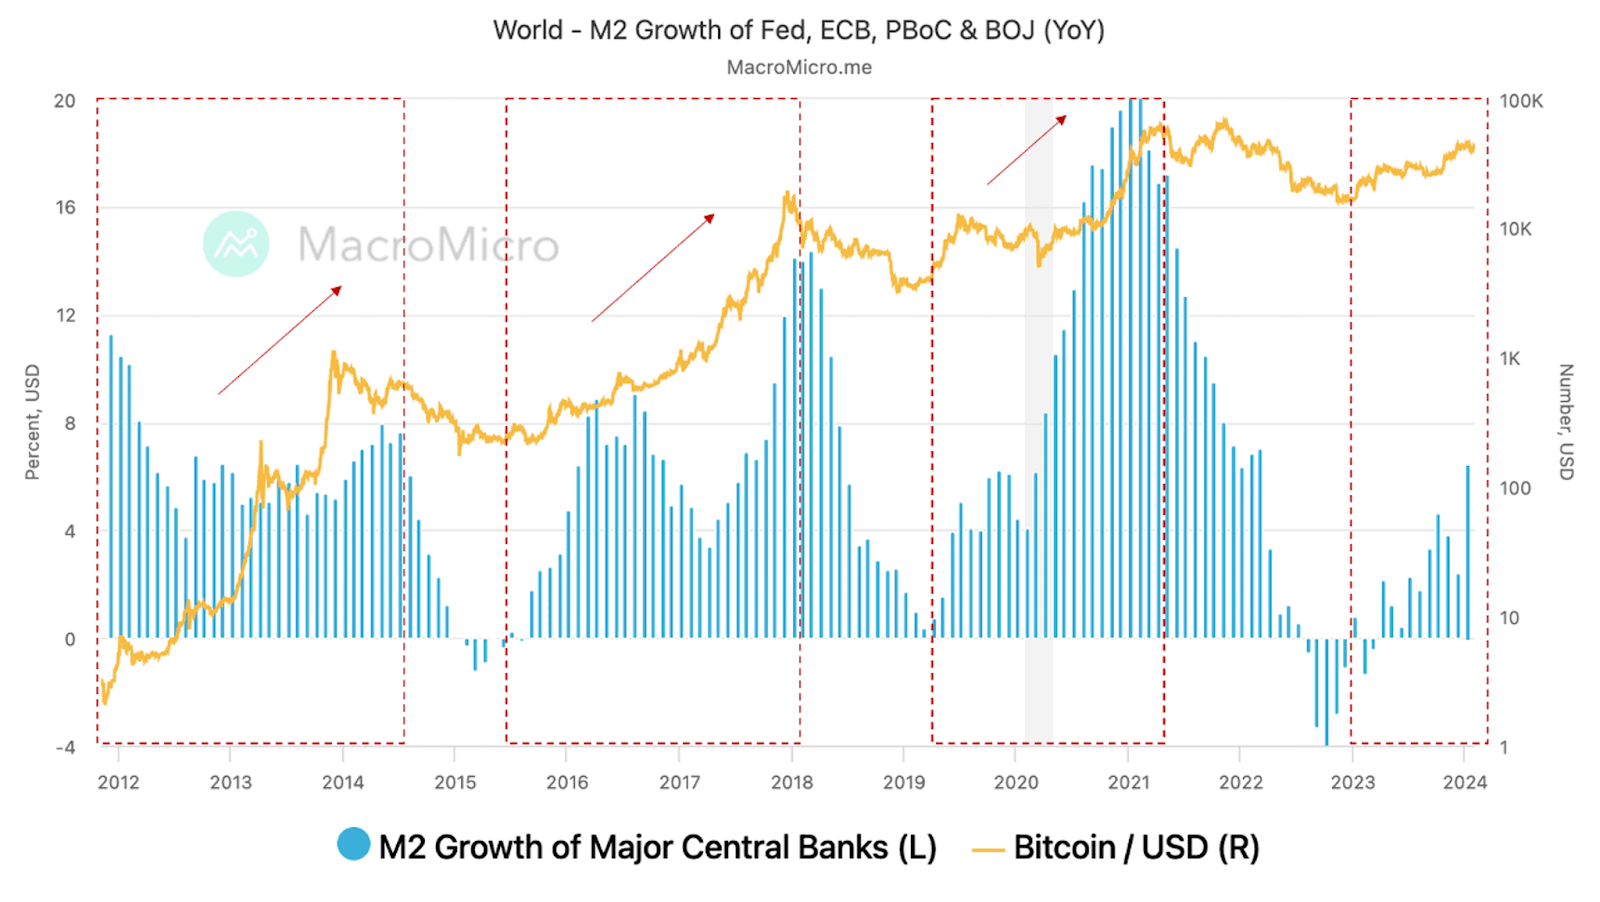
When liquidity is abundant, investors seek higher returns and favor riskier assets. Among these risk assets, Bitcoin records a high beta coefficient of about 1.5 to 2 times, meaning it rises much more sharply when the overall market goes up. Beta coefficient is an indicator that shows how sensitive an individual asset is to overall market movements. Due to this characteristic, the correlation between global M2 growth and Bitcoin price is high, showing a pattern where money flows into Bitcoin when liquidity increases. This makes global liquidity trends a key indicator to consider when developing Bitcoin investment strategies.
5.1.2. Institutional Inflows
The January 2024 approval of spot Bitcoin ETFs by the U.S. SEC was a transformative moment for the Bitcoin market. ETFs have become the easiest and safest way for traditional financial institutions and high-net-worth investors to access Bitcoin. We now view ETF capital flows from firms like BlackRock and Fidelity as a real-time gauge of institutional sentiment.
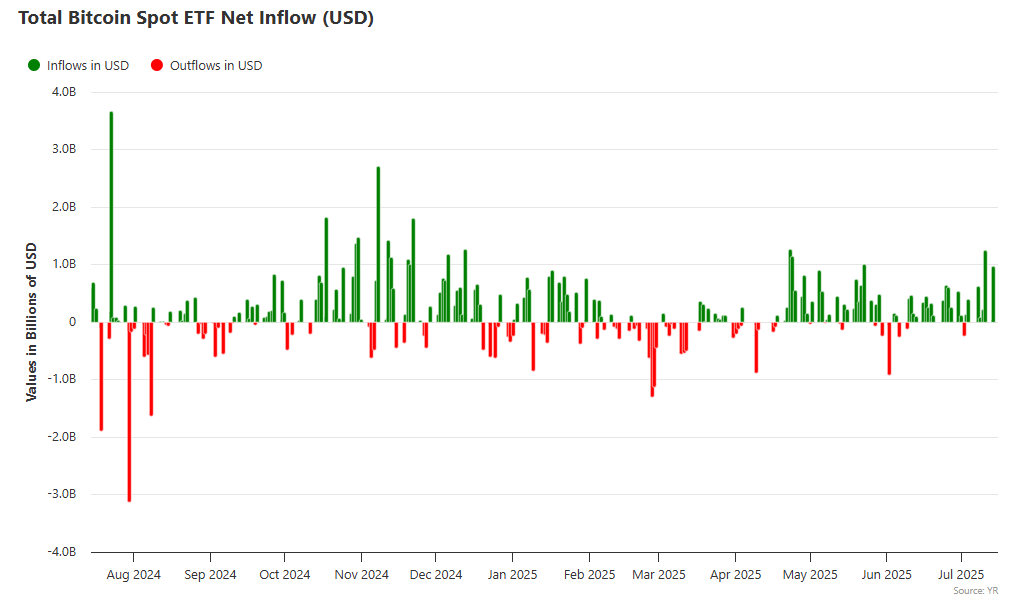
What makes ETF inflows important is their underlying mechanism. When investors purchase spot Bitcoin ETFs, the fund provider must buy the equivalent amount of physical Bitcoin. Most spot ETFs use custodians to hold actual Bitcoin, meaning inflows result in direct demand for spot BTC, pushing prices up. Conversely, redemptions create selling pressure.
Following ETF approval, cumulative net inflows exceeded about $50 billion, with billions flowing weekly from late 2024 into early 2025. Bitcoin surpassed $100,000 for the first time on December 5, 2024, and ETF flows were clearly a primary driver. This shows how critical ETF flow data has become.
5.1.3. Regulatory & Ecosystem Score
The final variable is the regulatory and ecosystem environment. While more qualitative and difficult to quantify, this factor is critical in determining the "trust premium" applied to Bitcoin. In environments with regulatory uncertainty, investors demand higher risk discounts. In clear and supportive regulatory environments, a premium is often added.
On the regulatory side, we assess: 1) National policy directions, 2) Licensing systems, 3) Tax frameworks, 4) Capital mobility. On the ecosystem side, we monitor: 5) Stablecoin market cap, 6) DeFi TVL, 7) Progress of major projects, 8) Frequency of security incidents.
These are scored on a 0–10 scale to provide a standardized evaluation of the investment environment.
The 2024 U.S. ETF approval serves as a perfect example of how regulatory clarity can drive large-scale capital inflows. Bitcoin is increasingly being recognized not as a speculative asset operating in a regulatory gray zone, but as a legitimate institutional asset. We believe this indicator will grow in importance going forward.
🐯 More from Tiger Research
Read more reports related to this research.[Special Report] Vietnam Crypto Market 2025: Complete Analysis of 21 Million Investor
[Special Report] Malaysia Crypto Market 2025: The Hidden Force Behind Global Web3 Giants
Disclaimer
The Bitcoin valuation methodology presented in this document (hereinafter referred to as the “Methodology”) is intended solely for educational and academic research purposes. It does not constitute investment advice, a solicitation to buy or sell, or a recommendation to engage in any form of trading activity. The fair prices derived from this Methodology are theoretical outputs based on objective data and mathematical models. They should not be interpreted as guidance or endorsement for any specific investment action, including buying, selling, or holding Bitcoin.
This Methodology is designed as a research framework to offer one perspective on Bitcoin valuation. It is not intended to be used as the basis for actual investment decisions.
The Methodology has been carefully reviewed to ensure it does not constitute any form of market manipulation, fraudulent trading, or other unfair trading practices as defined under Article 10 of the “Act on the Protection of Virtual Asset Users” (the “Virtual Asset User Protection Act”). All analysis uses only publicly available information, including on-chain blockchain data and officially released economic indicators. No material non-public or insider information has been used. All valuation outputs, including target prices, are based on reasonable assumptions and presented without misrepresentation or omission of material facts.
The authors and distributors of this Methodology fully comply with the conflict of interest disclosure requirements set forth in Article 10, Paragraph 4, Item 2 of the Virtual Asset User Protection Act. If the authors hold or intend to trade the relevant virtual asset (Bitcoin) at the time of writing or distribution, such interests will be transparently disclosed.
The indicators used in this Methodology—such as Base Price, Fundamental Indicator, and Macro Indicator—are derived from approaches the authors consider reasonable. However, they do not represent absolute truths or definitive answers. The Bitcoin market is highly volatile, operates 24/7, spans global jurisdictions, and is subject to significant regulatory uncertainty. As a result, there may be substantial and prolonged deviations between the valuation results of this Methodology and actual market prices.
This Methodology is based on historical data and information available at the time of writing. It does not guarantee or predict future performance. Past patterns or correlations may not persist, and unexpected market shocks, regulatory shifts, technical failures, or macroeconomic events could significantly undermine the predictive validity of this framework. Given the relatively short history and evolving nature of the crypto market, there are inherent limitations to the reliability of past data and its applicability to future projections.
All investment decisions should be made independently and under the investor’s sole responsibility. This Methodology should not serve as the sole or primary basis for any investment decision. Investors must carefully consider their financial situation, investment objectives, risk tolerance, and experience, and should seek independent financial or investment advice as needed. The authors, distributors, and any related parties bear no responsibility for any direct, indirect, consequential, special, or punitive losses or damages arising from investment decisions made with reference to this Methodology.
Terms of Usage
Tiger Research allows the fair use of its reports. ‘Fair use’ is a principle that broadly permits the use of specific content for public interest purposes, as long as it doesn't harm the commercial value of the material. If the use aligns with the purpose of fair use, the reports can be utilized without prior permission. However, when citing Tiger Research's reports, it is mandatory to 1) clearly state 'Tiger Research' as the source, 2) include the Tiger Research logo. If the material is to be restructured and published, separate negotiations are required. Unauthorized use of the reports may result in legal action.


