

Key Takeaways
Driven by real financial ‘skin in the game’, prediction markets dynamically update in real time to provide precise probability distributions that continuously match or exceed the accuracy of traditional polls, expert surveys, and economic forecasts.
Prediction markets have evolved beyond sports and election forecasting into crucial macroeconomic and geopolitical data infrastructure, widely adopted by major financial media, central bank researchers, and institutional market platforms.
To establish prediction market data as trusted decision-making infrastructure worldwide, platforms must deepen liquidity to resist manipulation, actively engage regulators to reframe markets as monitoring tools, and maintain open, transparent data backed by independent research.
1. From Betting to Valuable Data
The first report covered the definition of prediction markets and how they work, and the second report covered the major regulatory developments. The central point of both reports is that prediction markets serve as valuable data, not merely as a venue for betting.
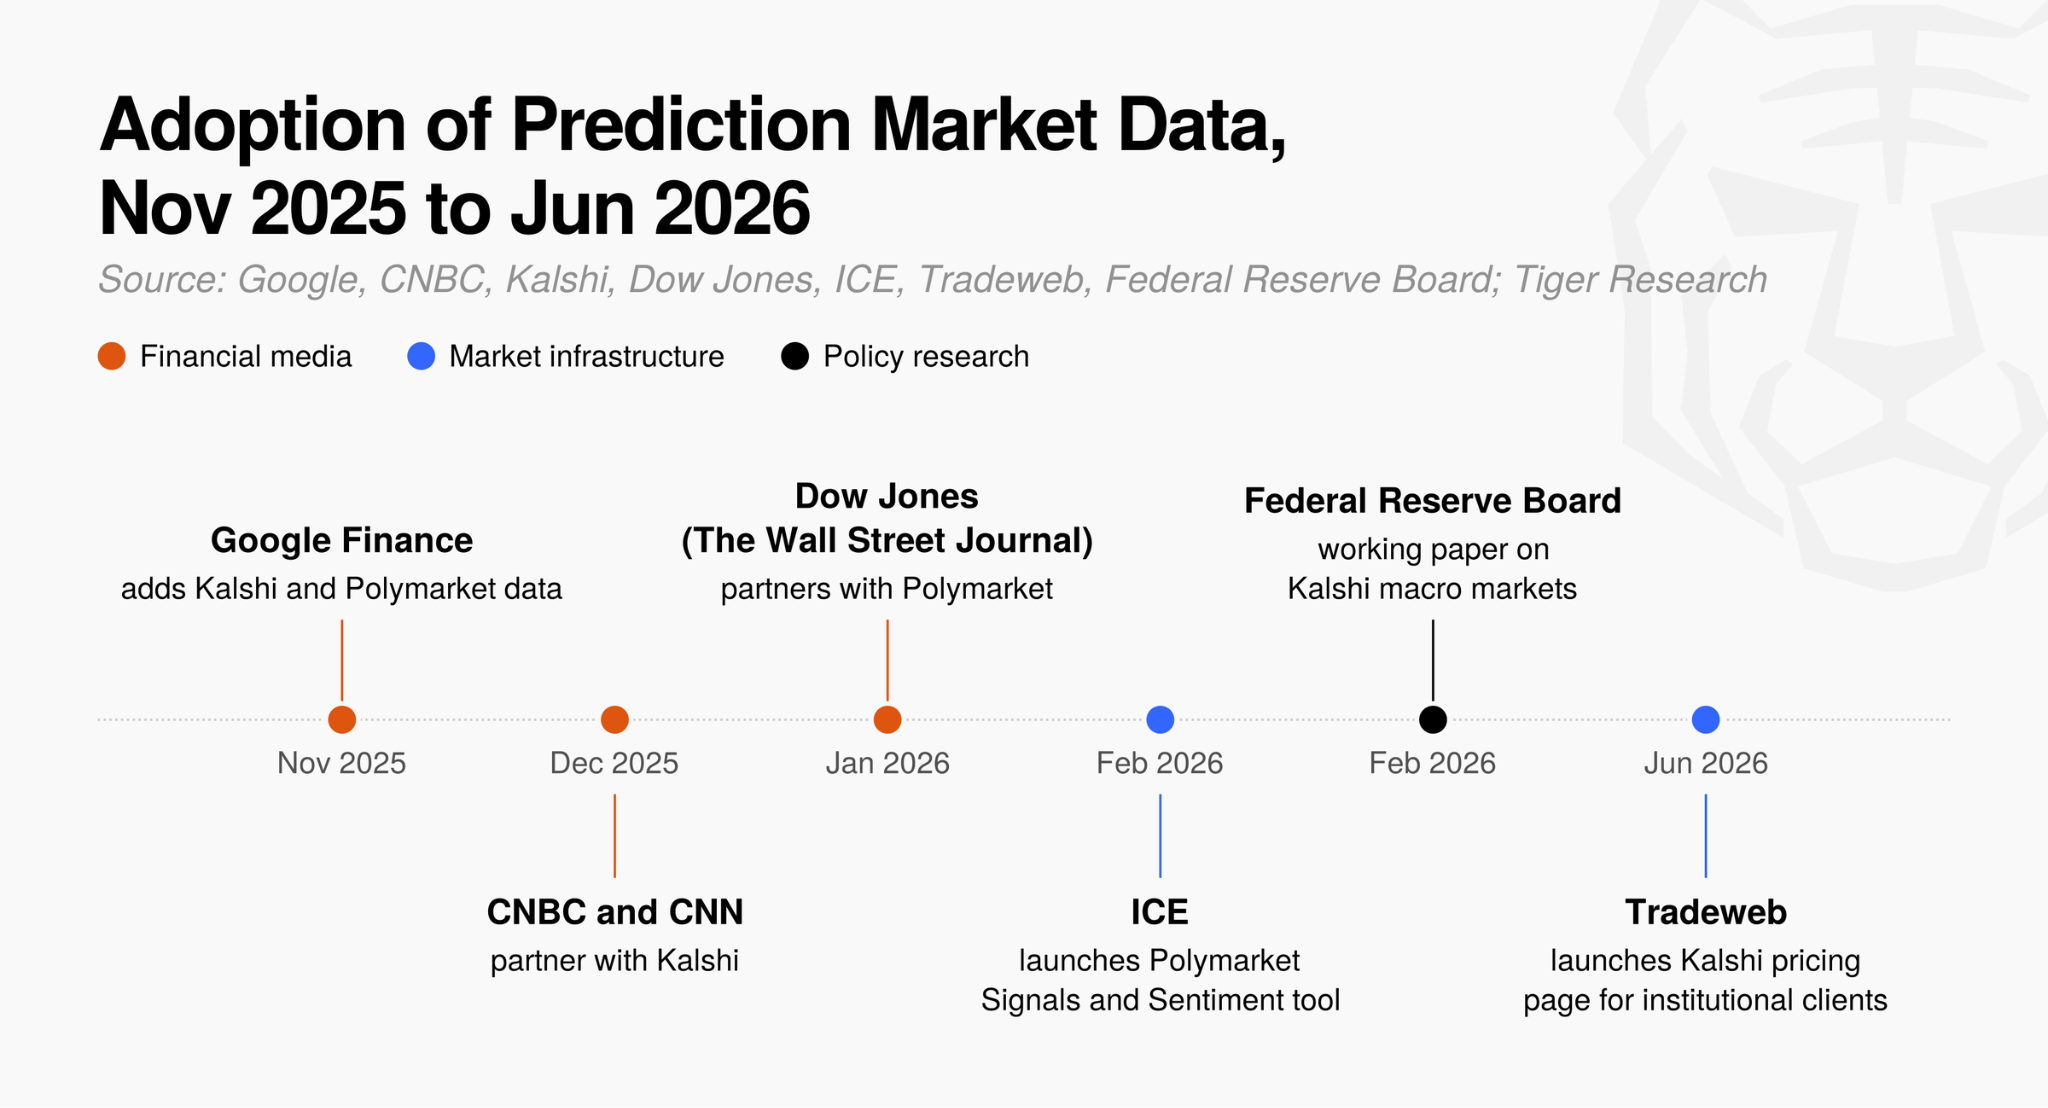
Major financial media and market infrastructure providers have begun to adopt prediction market data, which shows the value of that data.
Google Finance, CNBC, CNN, and The Wall Street Journal (WSJ) have started displaying prediction market probabilities, and Intercontinental Exchange (ICE), the parent company of the New York Stock Exchange, and Tradeweb, an electronic trading platform for bonds and other assets, now distribute prediction market data to institutional clients alongside their existing market data.
A Federal Reserve Board working paper has also described prediction market data as a benchmark for macroeconomic expectations, such as interest rate decisions, inflation, unemployment, and GDP growth.
A Federal Reserve Board economist and co-authors described the markets of Kalshi, a prediction market, as “a high-frequency, continuously updated, distributionally rich benchmark that is valuable to both researchers and policymakers” (Diercks, Katz and Wright, 2026). Prediction markets are thus starting to be seen as a data source rather than a betting site.
Industry has already recognized prediction market data as valuable and put it to use. This final report in the prediction market series examines the utility of that data through three questions:
How does a prediction market price become valuable data?
Where is prediction market data used?
Do today’s prediction markets produce that kind of data?
2. How Does a Prediction Market Price Become Valuable Data?
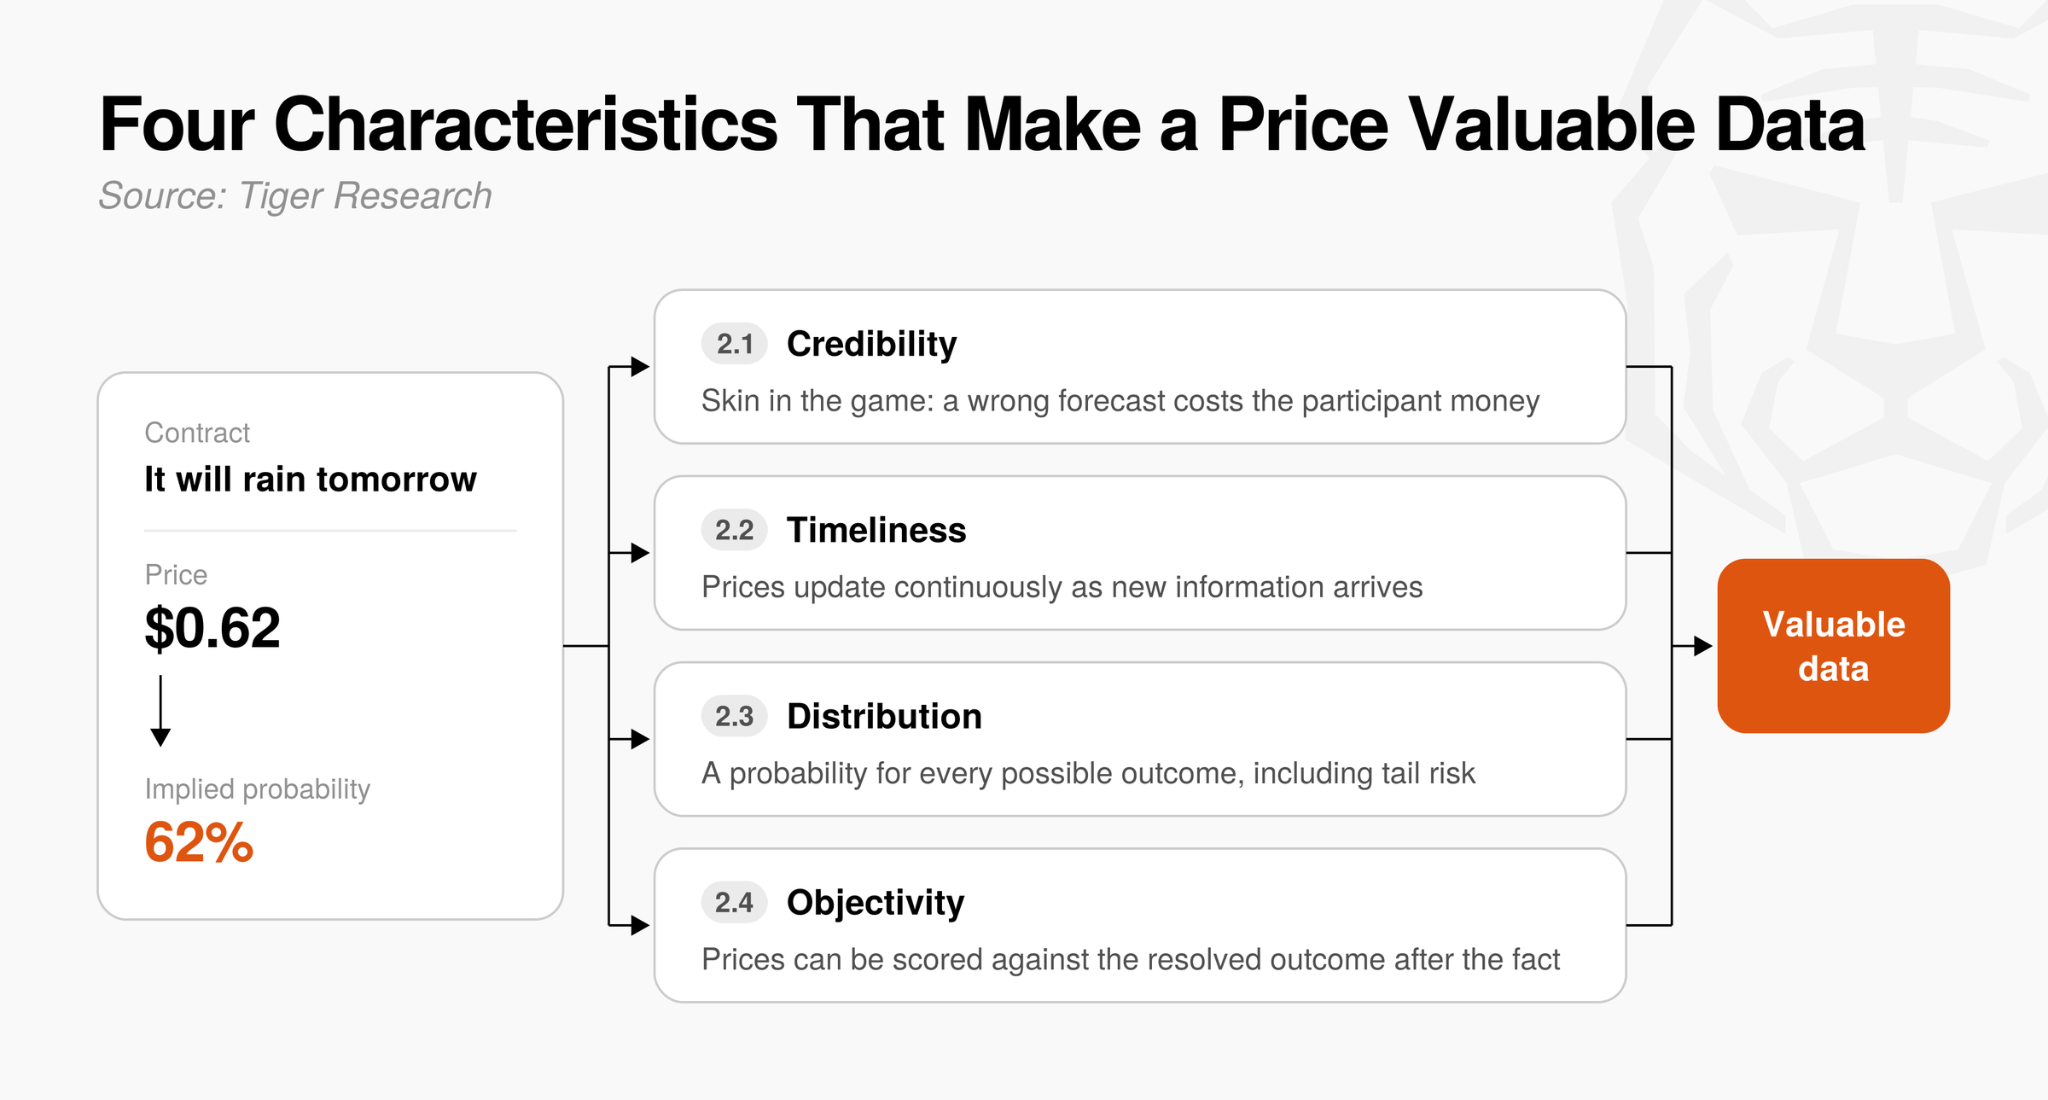
As covered in the first report, the core mechanism of a prediction market, the binary contract, normally pays out either $1 or $0 depending on whether a specific event occurs. For example, if a contract stating “It will rain tomorrow” trades at $0.62, market participants are estimating the probability of that event at 62%.
A prediction market price ($0.62) therefore works as an intuitive probability (62%) for a future event. Four structural characteristics explain why these prices count as valuable data that global financial institutions and media use in actual decisions, not as mere betting odds.
2.1. Credibility Through Skin in the Game
Some regard betting on prediction markets as plain gambling, but putting money at stake gives participants real ‘skin in the game.’
‘Skin in the game’ means bearing the risk and responsibility of one’s own decisions. Unlike an opinion that costs nothing to state, a wrong prediction costs participants their own money, so they build only carefully verified information and genuine beliefs into the price.
When many predictions with money at stake are aggregated, the prediction market price becomes highly reliable probability data, provided the market has sufficient liquidity.
2.2. Timeliness Through Continuous Real-Time Updates
Traditional polls and expert surveys provide only a snapshot from the time they were conducted, so they are slow to capture fast-moving changes. For example, if a sudden external economic shock or an emergency statement arrives today, ahead of a central bank rate decision due tomorrow, a poll finished several days ago or a monthly expert survey cannot reflect it at all.
Prediction market prices, by contrast, change the moment new information enters the market. Prices update continuously because participants readjust their positions whenever news, unexpected developments, or regulatory announcements arrive.
A prediction market price is therefore not a probability fixed in the past but timely data that reflects changes as they happen.
2.3. Probability Distributions Across Outcomes
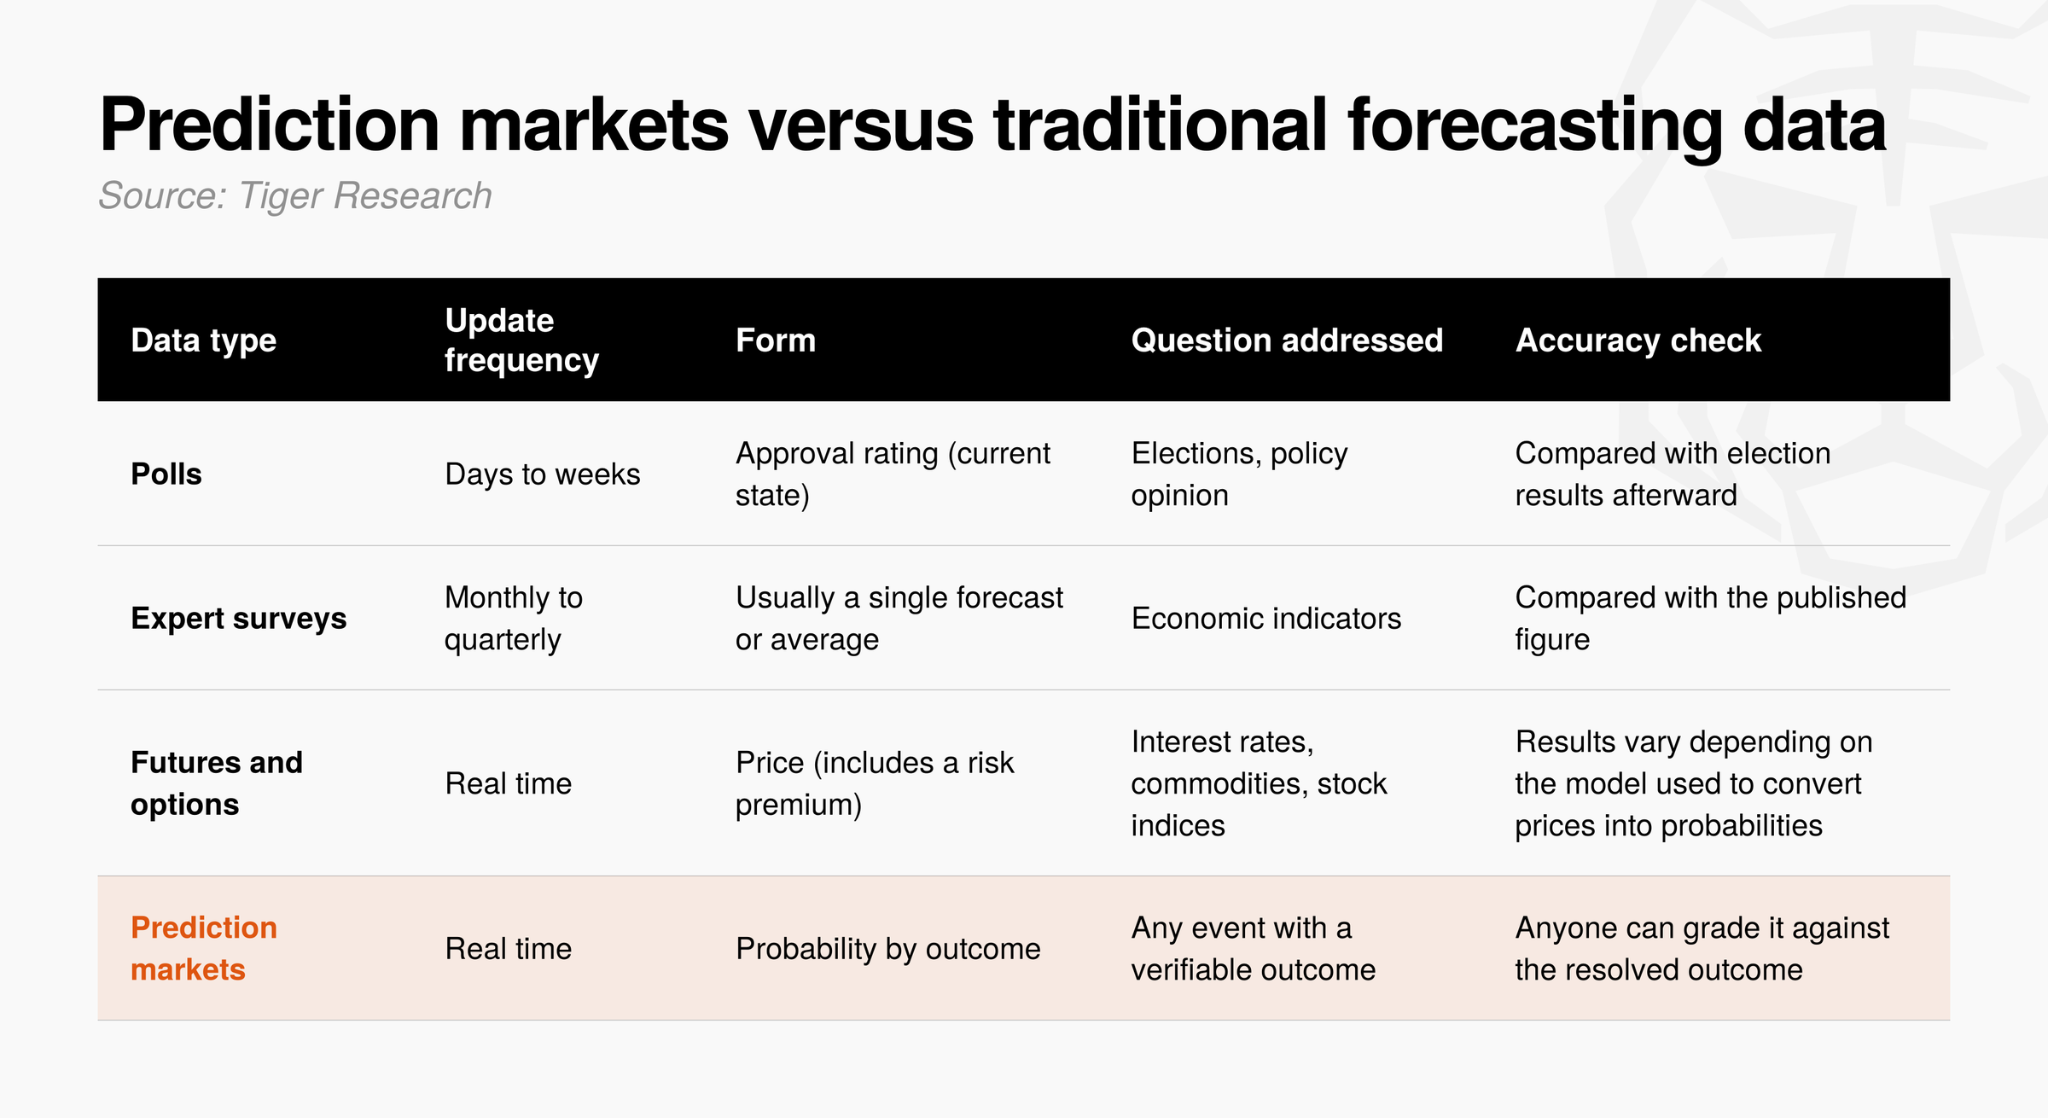
Traditional indicators that center on a single average or peak value lose information because they compress many opinions into one number. For example, when forecasting a central bank rate cut, a typical expert survey shows only one average figure, such as a “0.25 percentage point cut,” and cannot show scenarios that depend on how committee members’ remarks shift.
Prediction markets, by contrast, produce a ‘probability distribution’ across every possible outcome. A probability distribution here shows the probability of every possible scenario together rather than a single outcome (for example, hold 20%, 0.25 percentage point cut 70%, 0.5 percentage point cut 10%). It is also a continuous time series.
This lets a prediction market measure not only the most likely central value but also tail risk, meaning outcomes that are unlikely but would have a very large impact if they occurred. Prediction markets therefore provide more than a single-point figure: their probability distributions support an overall assessment of future market volatility and potential risk.
2.4. Objectivity Through Verification After the Fact
Prediction market data earns trust in academia and global financial markets above all because its results can be fully verified after the fact.
Ordinary expert forecasts and surveys can also be checked for accuracy once the outcome is known, but the assessment usually leaves much room for interpretation, and institutions tend to cite only the track record that favors them. Prediction market data, by contrast, is recorded in full as a clear quantitative price (probability) and usually settles at 0 or 1 at expiry. Scoring is therefore mathematically exact and leaves no room for subjective interpretation.
Anyone can compare historical price data with actual outcomes transparently and without error. Because no one can manipulate this objective track record and it can be shown at any time, prediction market prices are more than subjective guesses: data professionals and institutions can rigorously judge their past accuracy, which gives the most reliable basis for adopting them as a core decision-making indicator.
3. Where Is Prediction Market Data Used?
Prediction market data has drawn public attention only recently, but its history goes back to the Iowa Electronic Markets (IEM) of the 1980s. For a long time its best-known use was forecasting elections, and its value has become more evident as prediction markets have recently been applied to a much wider range of areas.
3.1. Elections: Earlier and More Accurate Than Polls
The first case to show the potential of prediction markets was the Iowa Electronic Markets (IEM) described earlier. The IEM was compared against 964 poll results across five US presidential elections held from 1988 to 2004, and in 74% of cases it predicted the actual election result more accurately than the polls (Berg, Nelson and Rietz, 2008).
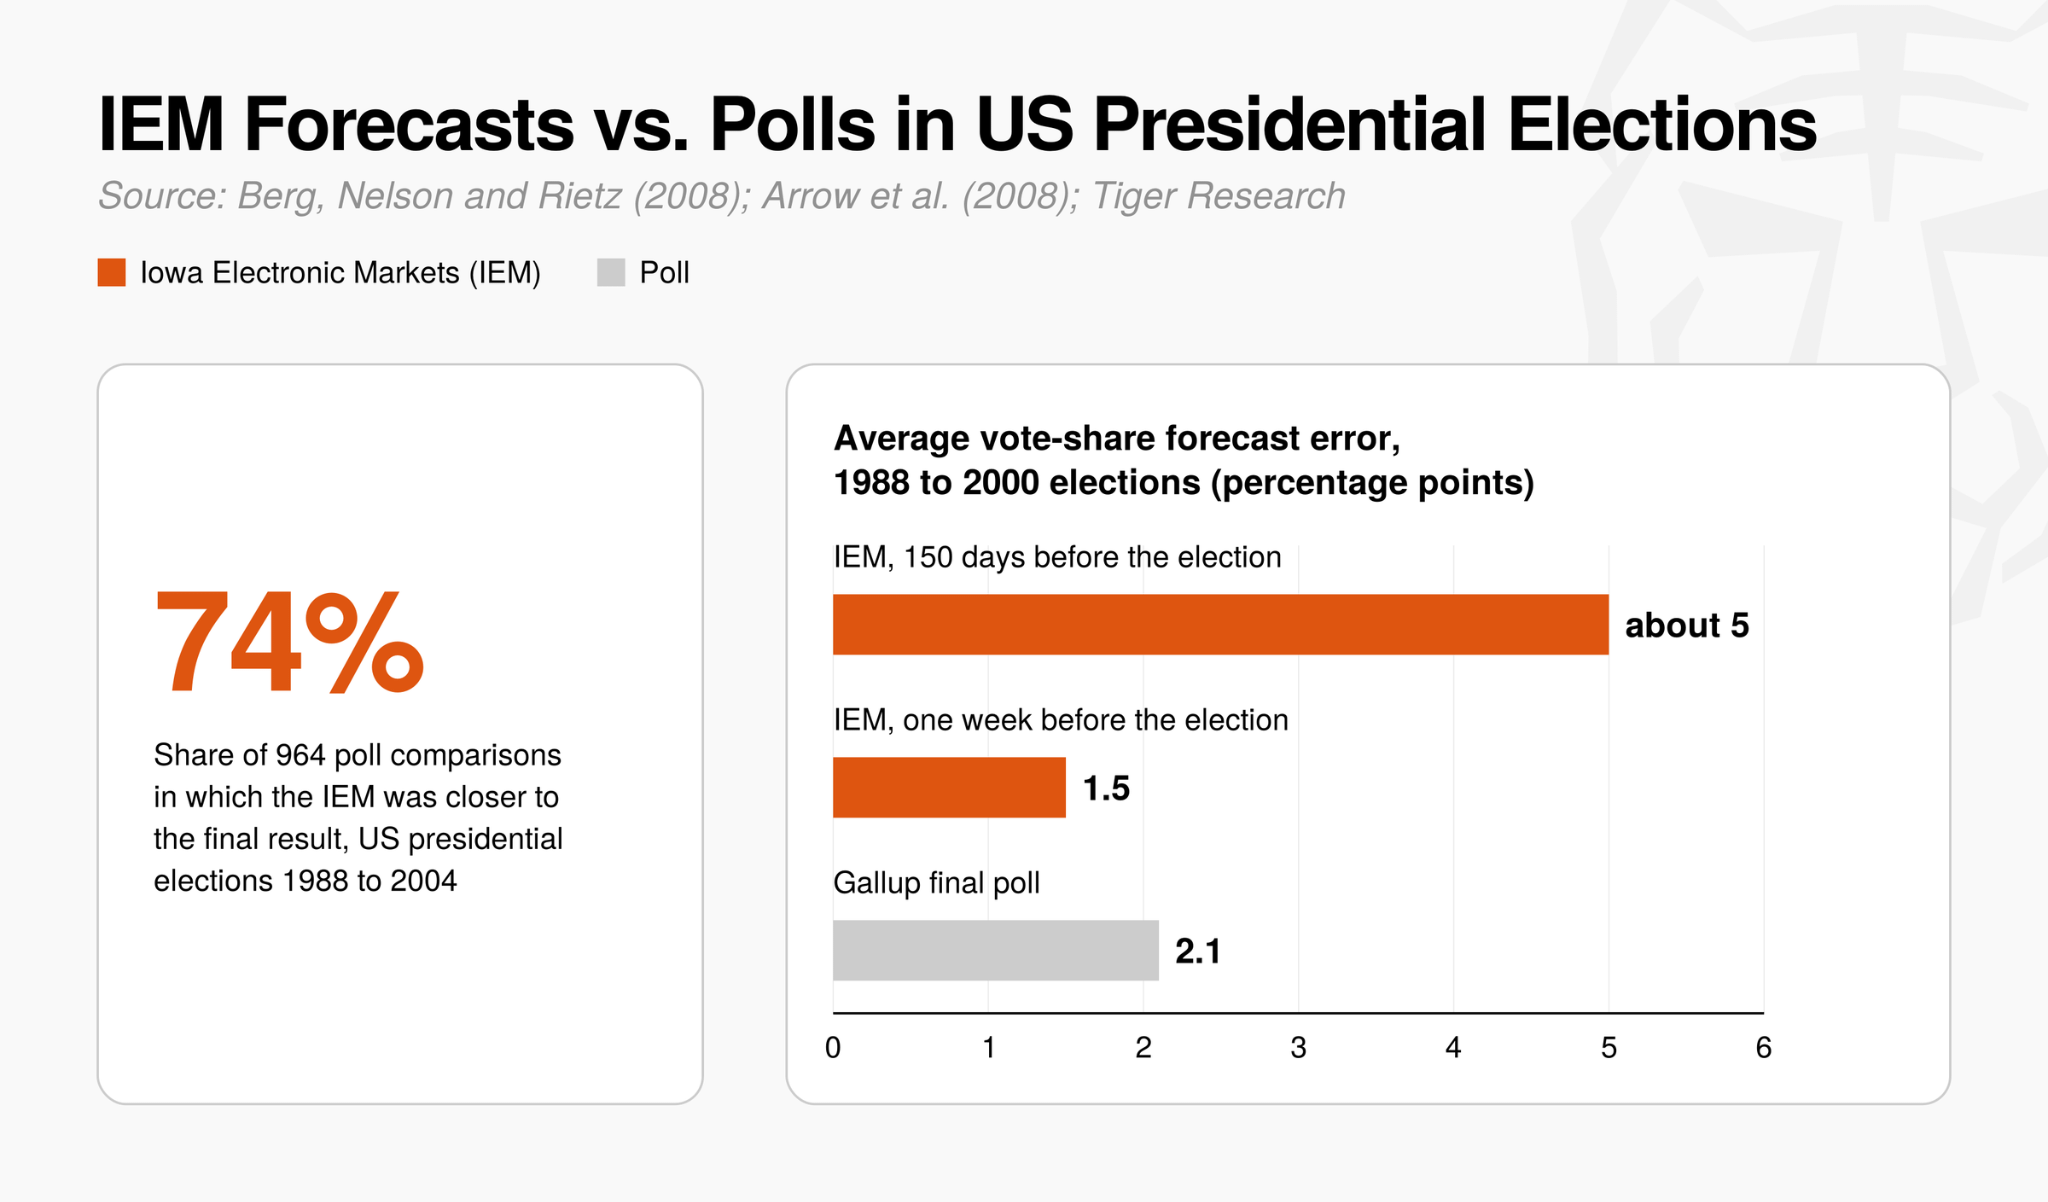
This advantage was not limited to the period just before elections. An analysis of the 1988 to 2000 presidential elections found that one week before the election, the IEM’s vote share forecast error (the gap from the actual vote share) averaged 1.5 percentage points, smaller than the 2.1 percentage point error of Gallup’s final poll, and even 150 days before the election the average error was only about 5 percentage points (Arrow et al., 2008).
The two figures cannot be compared directly, however. A poll is a current indicator that asks “if the vote were held today,” whereas a prediction market price is a forward-looking indicator of “the final result on election day.”
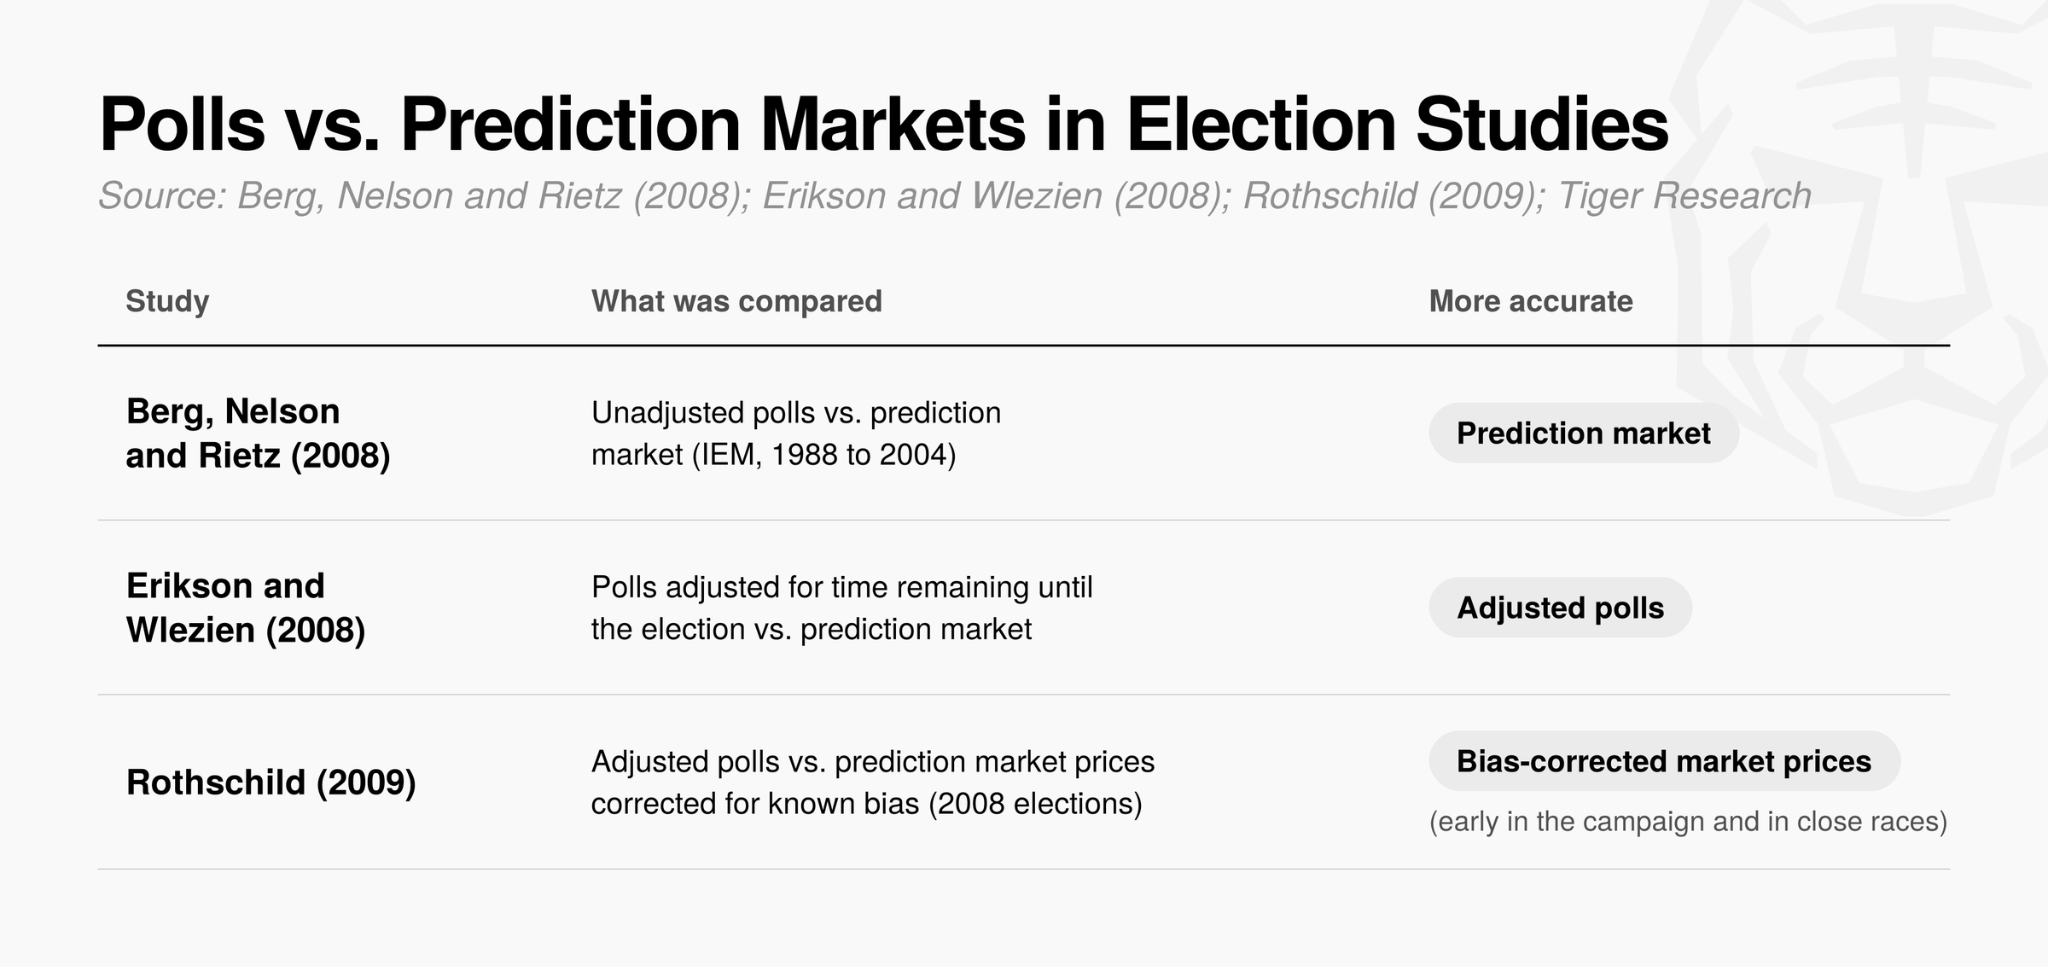
In fact, one study found that polls adjusted for the time remaining until the election were more accurate than prediction markets (Erikson and Wlezien, 2008). However, another analysis of the 2008 elections finds that when prediction market prices are corrected for their own known bias, they predict better than adjusted polls early in the campaign and in close races (Rothschild, 2009).
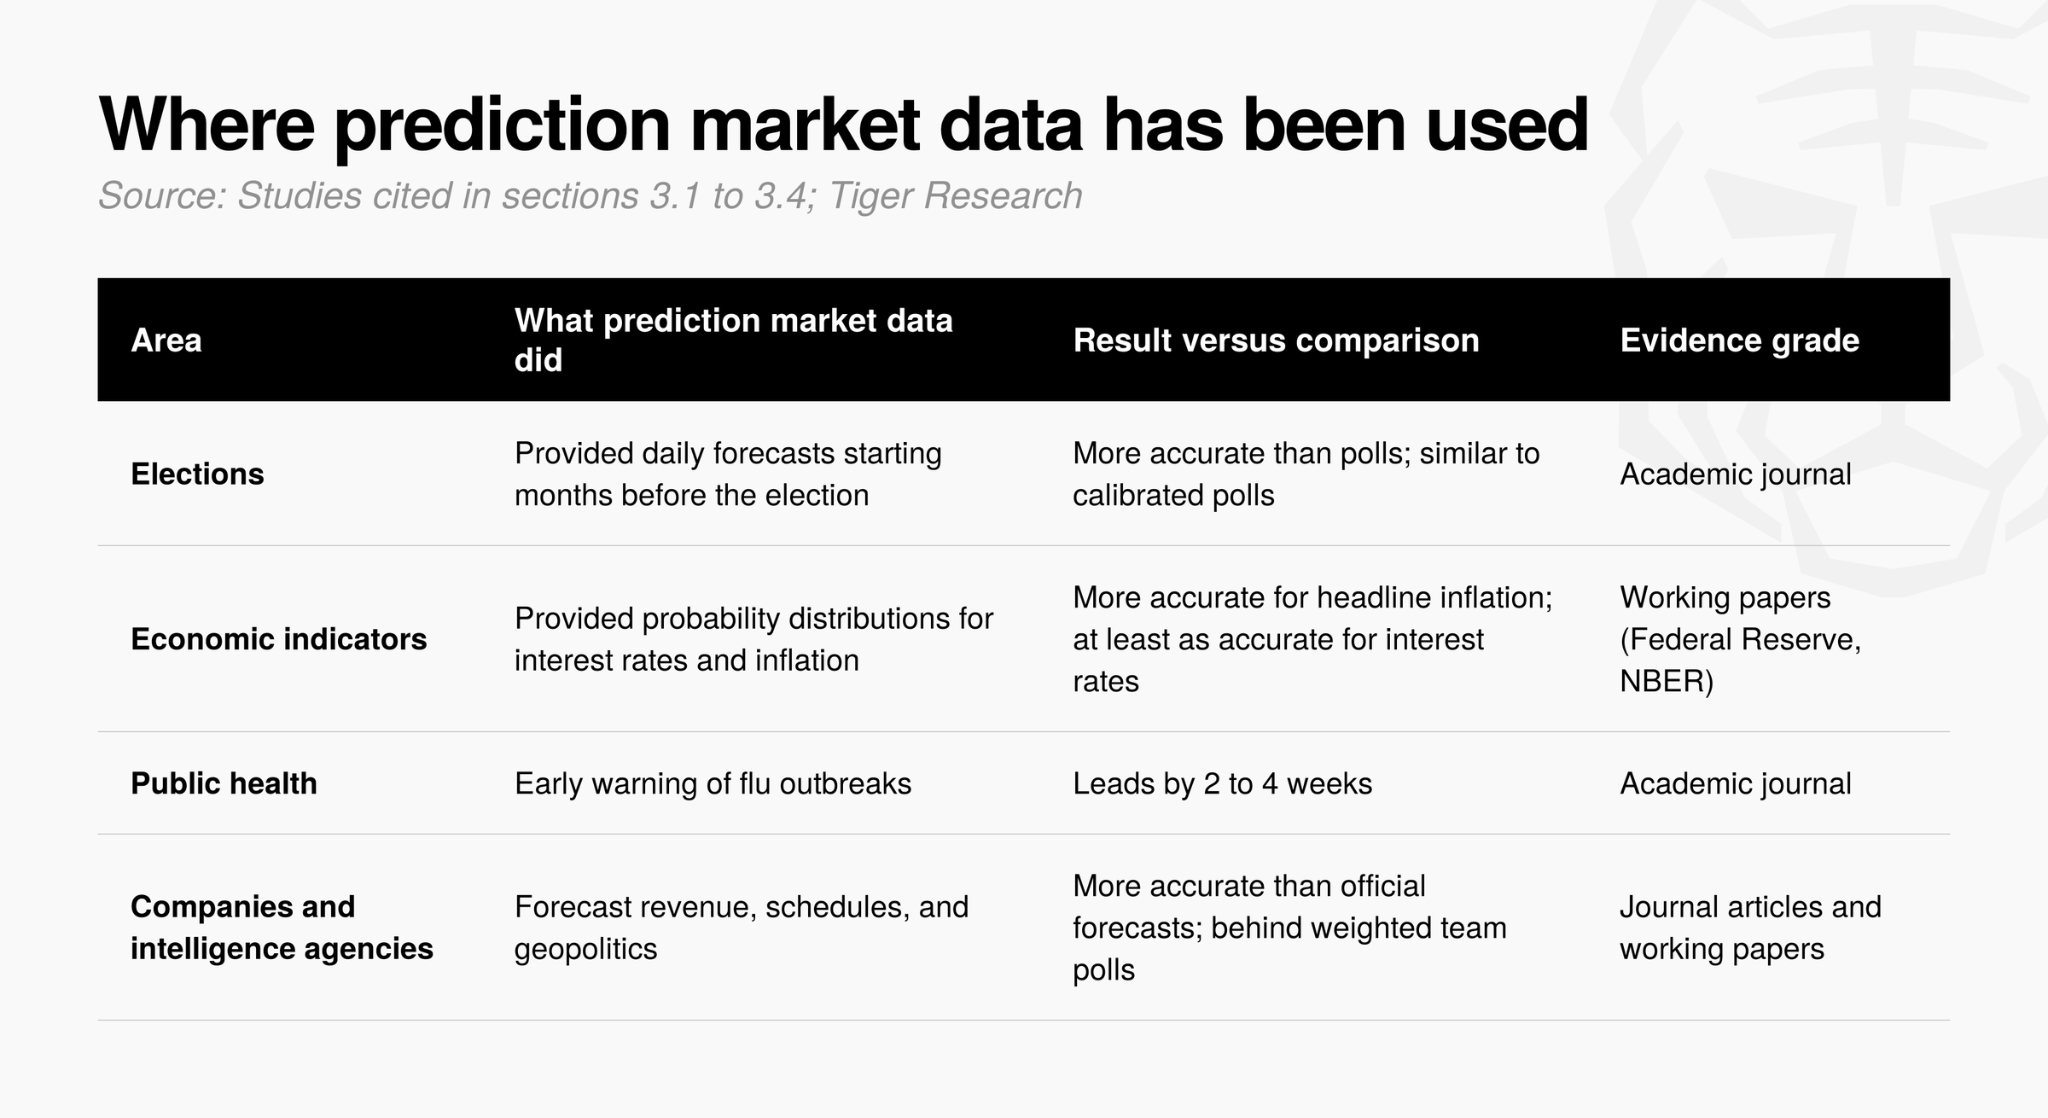
Prediction market prices are therefore more accurate than unadjusted polls and perform on par with highly calibrated polls. They also add value by providing forecasts that are updated every day from several months before an election.
3.2. Economy: Reading Macroeconomic Expectations in Real Time
For macroeconomic indicators such as interest rates, inflation, and employment, it is important to know accurately, before release, what the market expects.
Market expectations have traditionally been measured with expert surveys or the prices of traditional financial products. Surveys, however, are updated only every few weeks and so lack timeliness, while futures prices give a single figure, and option-implied distributions exist only for a few variables such as interest rates and headline inflation. Prediction markets, by contrast, produce a real-time probability distribution directly, through a price for each outcome.
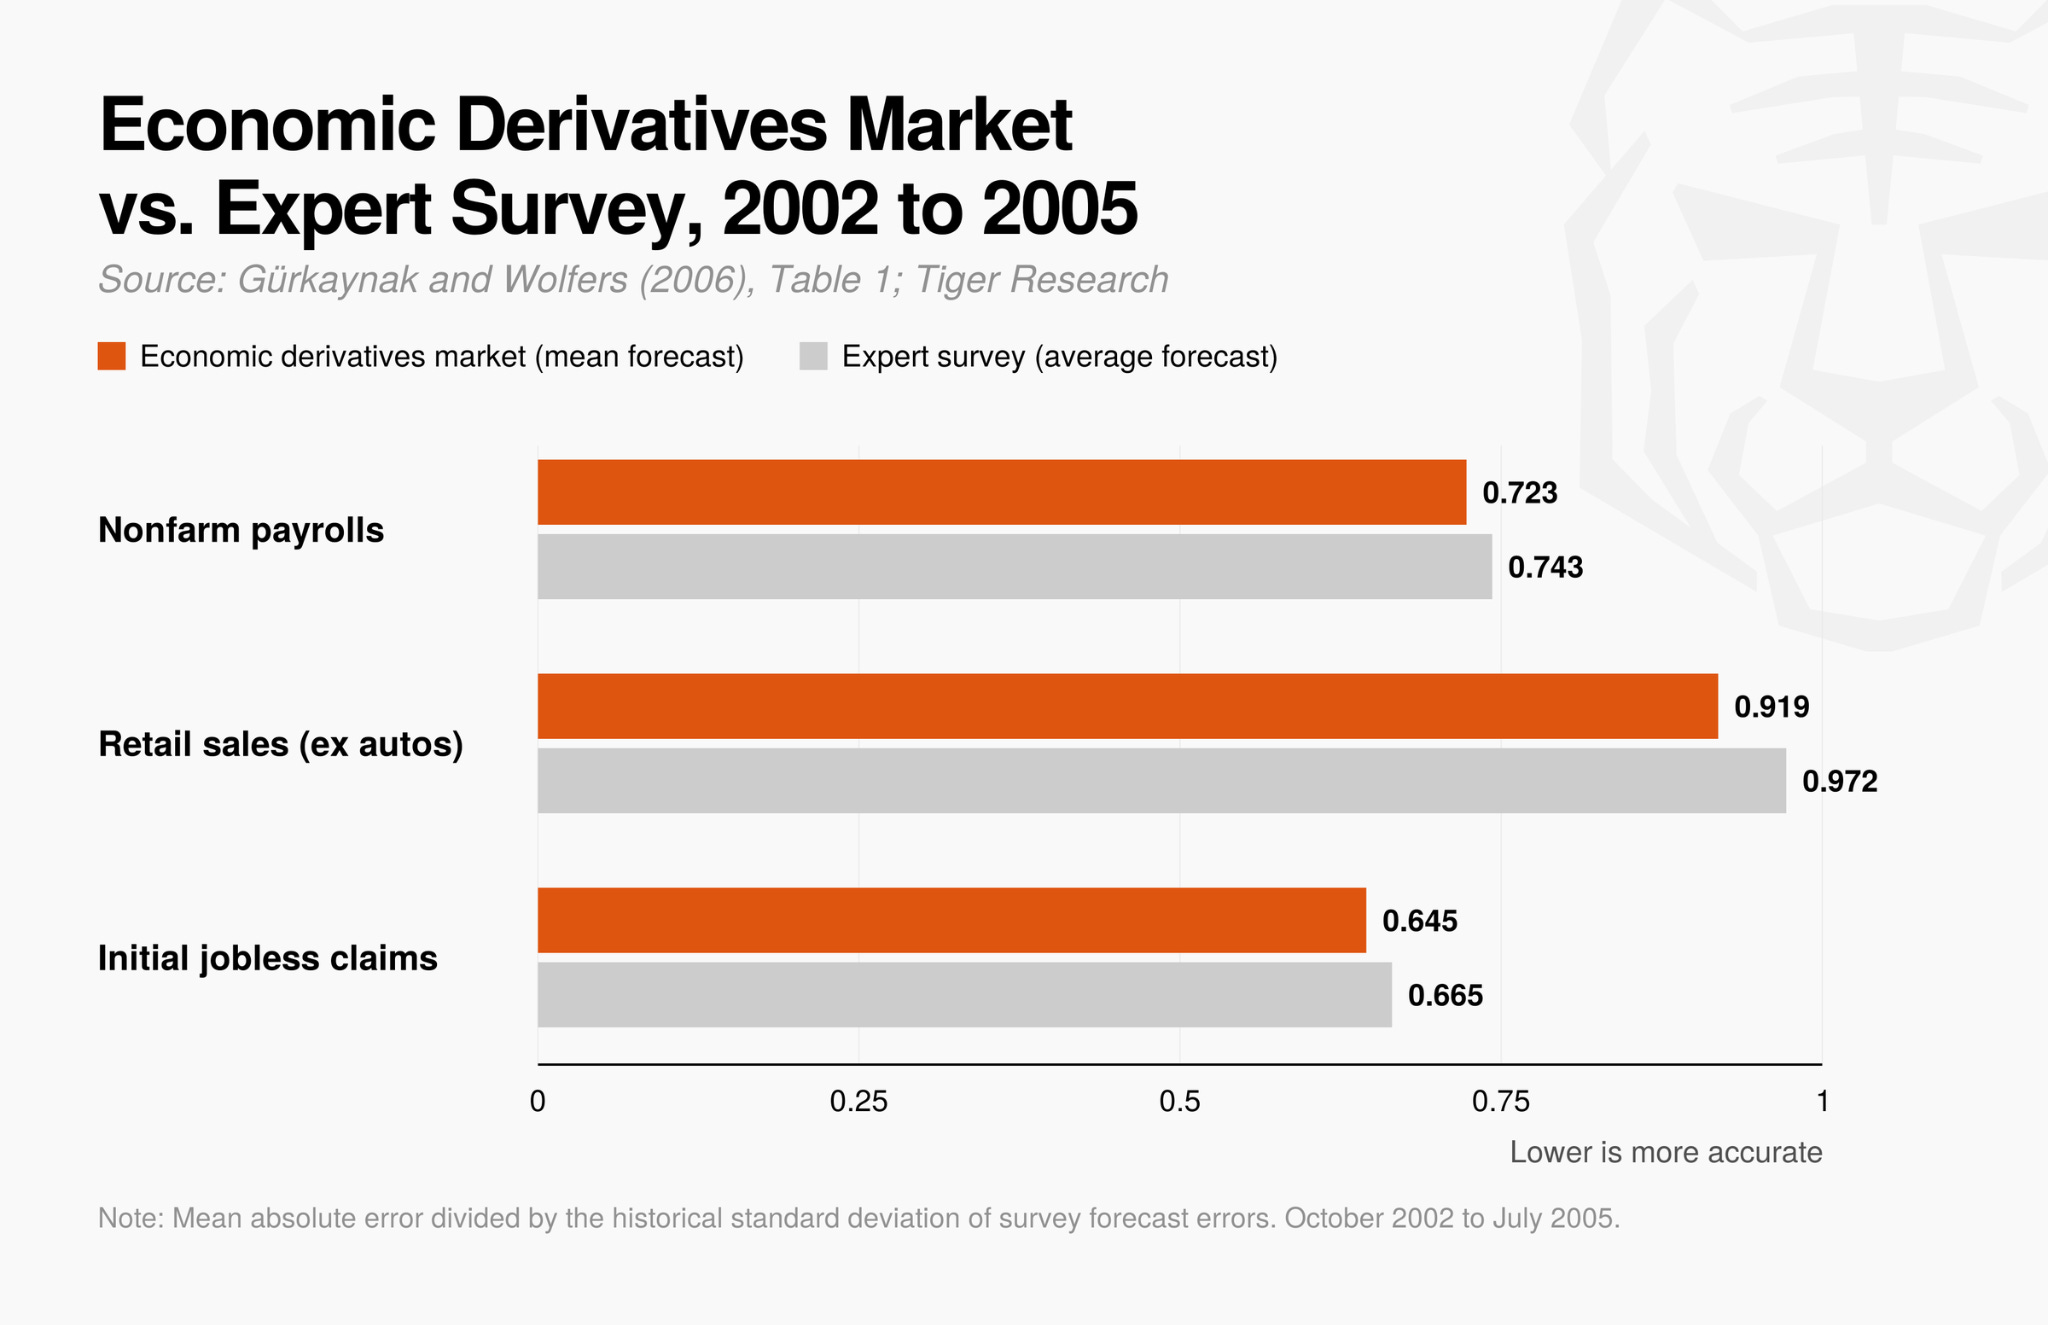
This quantitative utility was already demonstrated between 2002 and 2005 in the economic derivatives market. An analysis of binary option trading data tied to the released values of indicators such as nonfarm payrolls, retail sales, and initial jobless claims found that market-implied forecasts were as accurate as, or more accurate than, the average expert survey, and the probability distributions implied by the market closely matched how often events actually occurred (Gürkaynak and Wolfers, 2006).
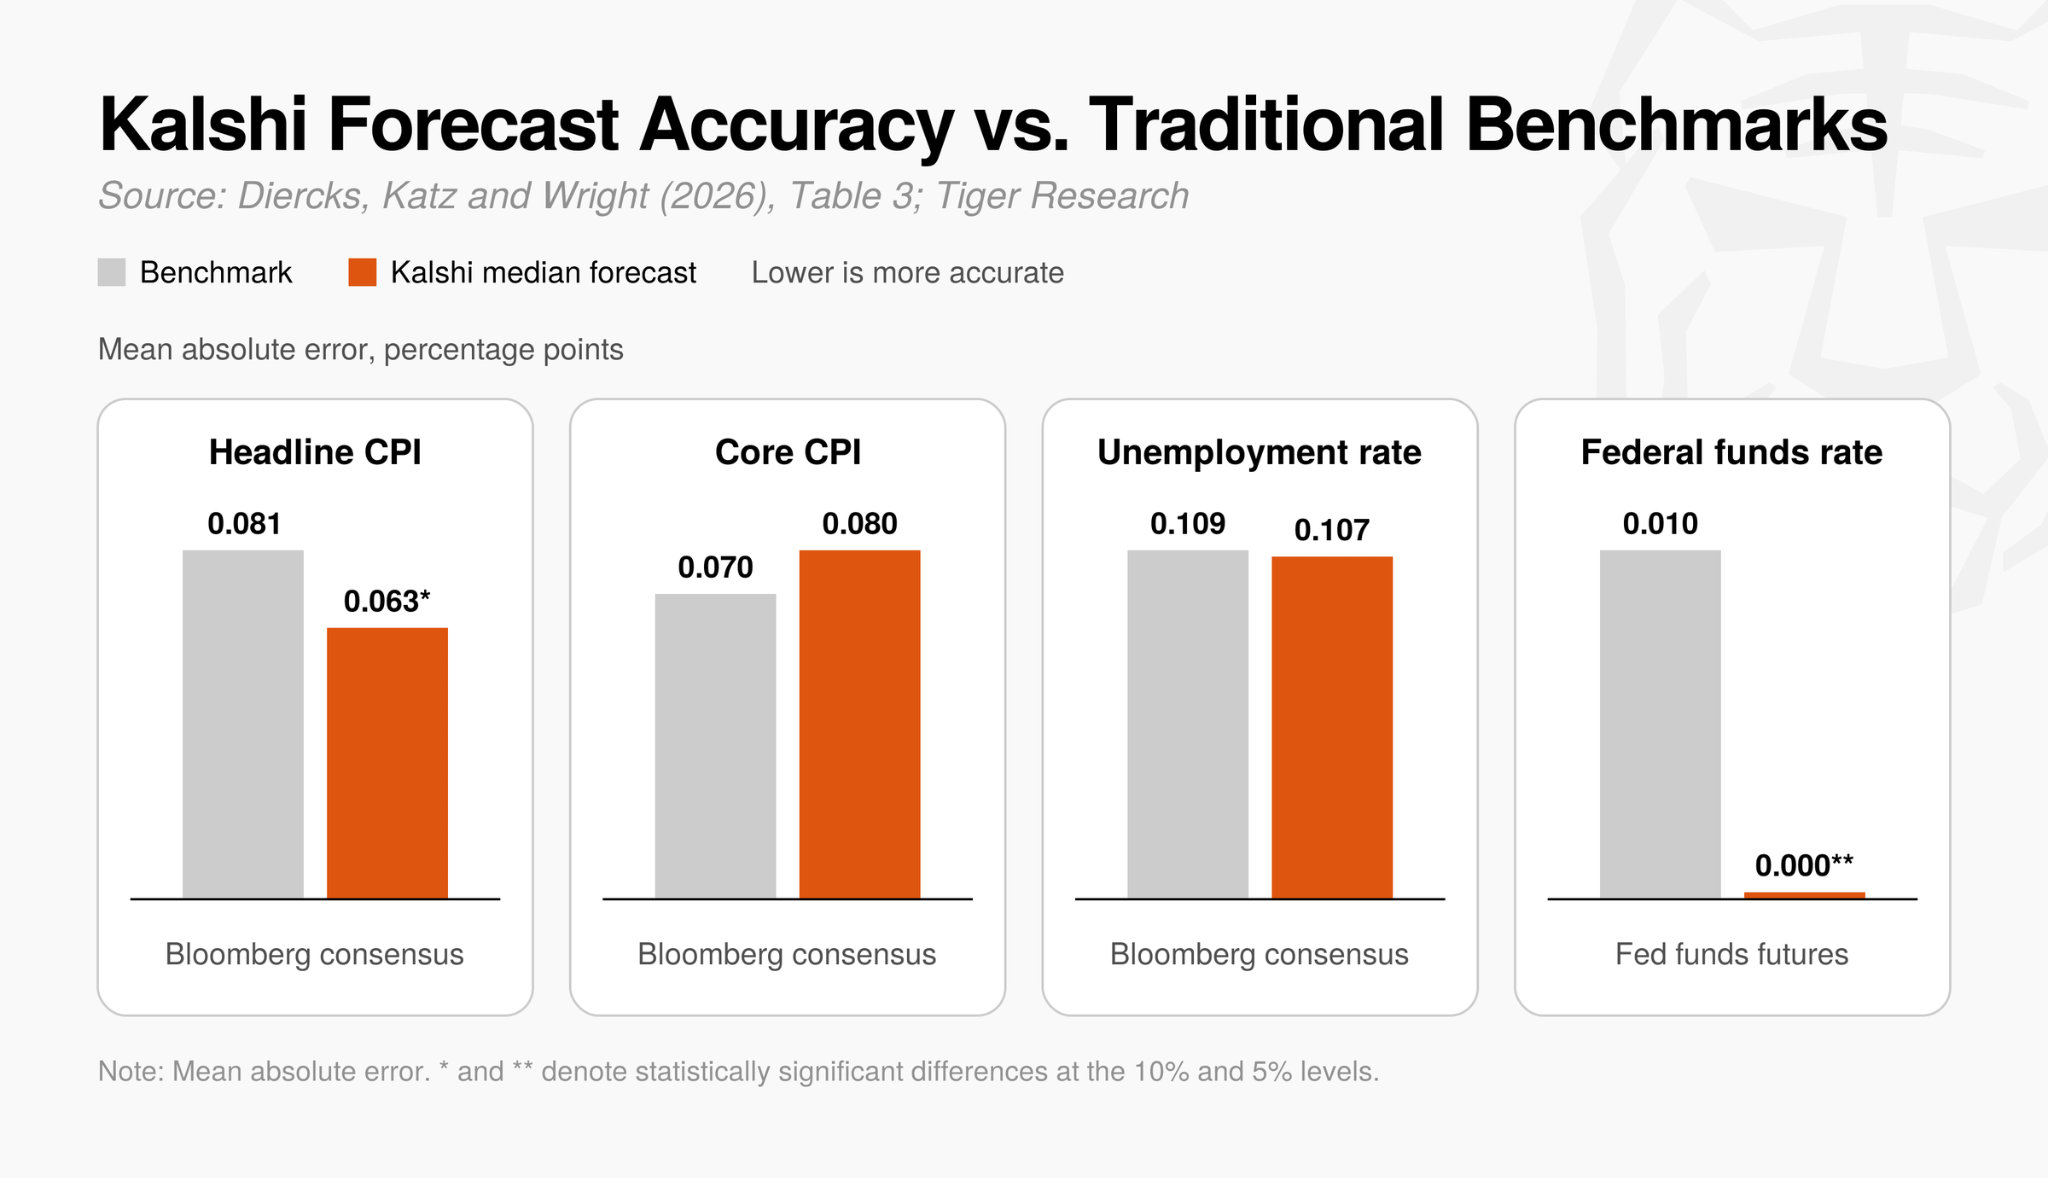
A recent Federal Reserve Board working paper (Diercks, Katz and Wright, 2026) evaluates prediction market forecasts against established benchmarks. The authors find that Kalshi’s median and mode forecasts for the federal funds rate had a perfect forecast record on the day before FOMC meetings and significantly outperformed fed funds futures at that horizon. Compared with the Bloomberg consensus, Kalshi forecasts were significantly more accurate for headline CPI inflation and statistically similar for core CPI inflation and unemployment. These findings suggest that prediction markets can improve on some benchmarks, while performing comparably to others.
The study also points to a broader range of practical applications beyond accuracy. Liquid derivatives-based indicators had not existed for key macro indicators such as GDP growth, core inflation, the unemployment rate, and nonfarm payrolls. Prediction markets remove this constraint by providing market-based expectations and detailed probability distributions in real time, which makes them a valuable benchmark for researchers and policymakers.
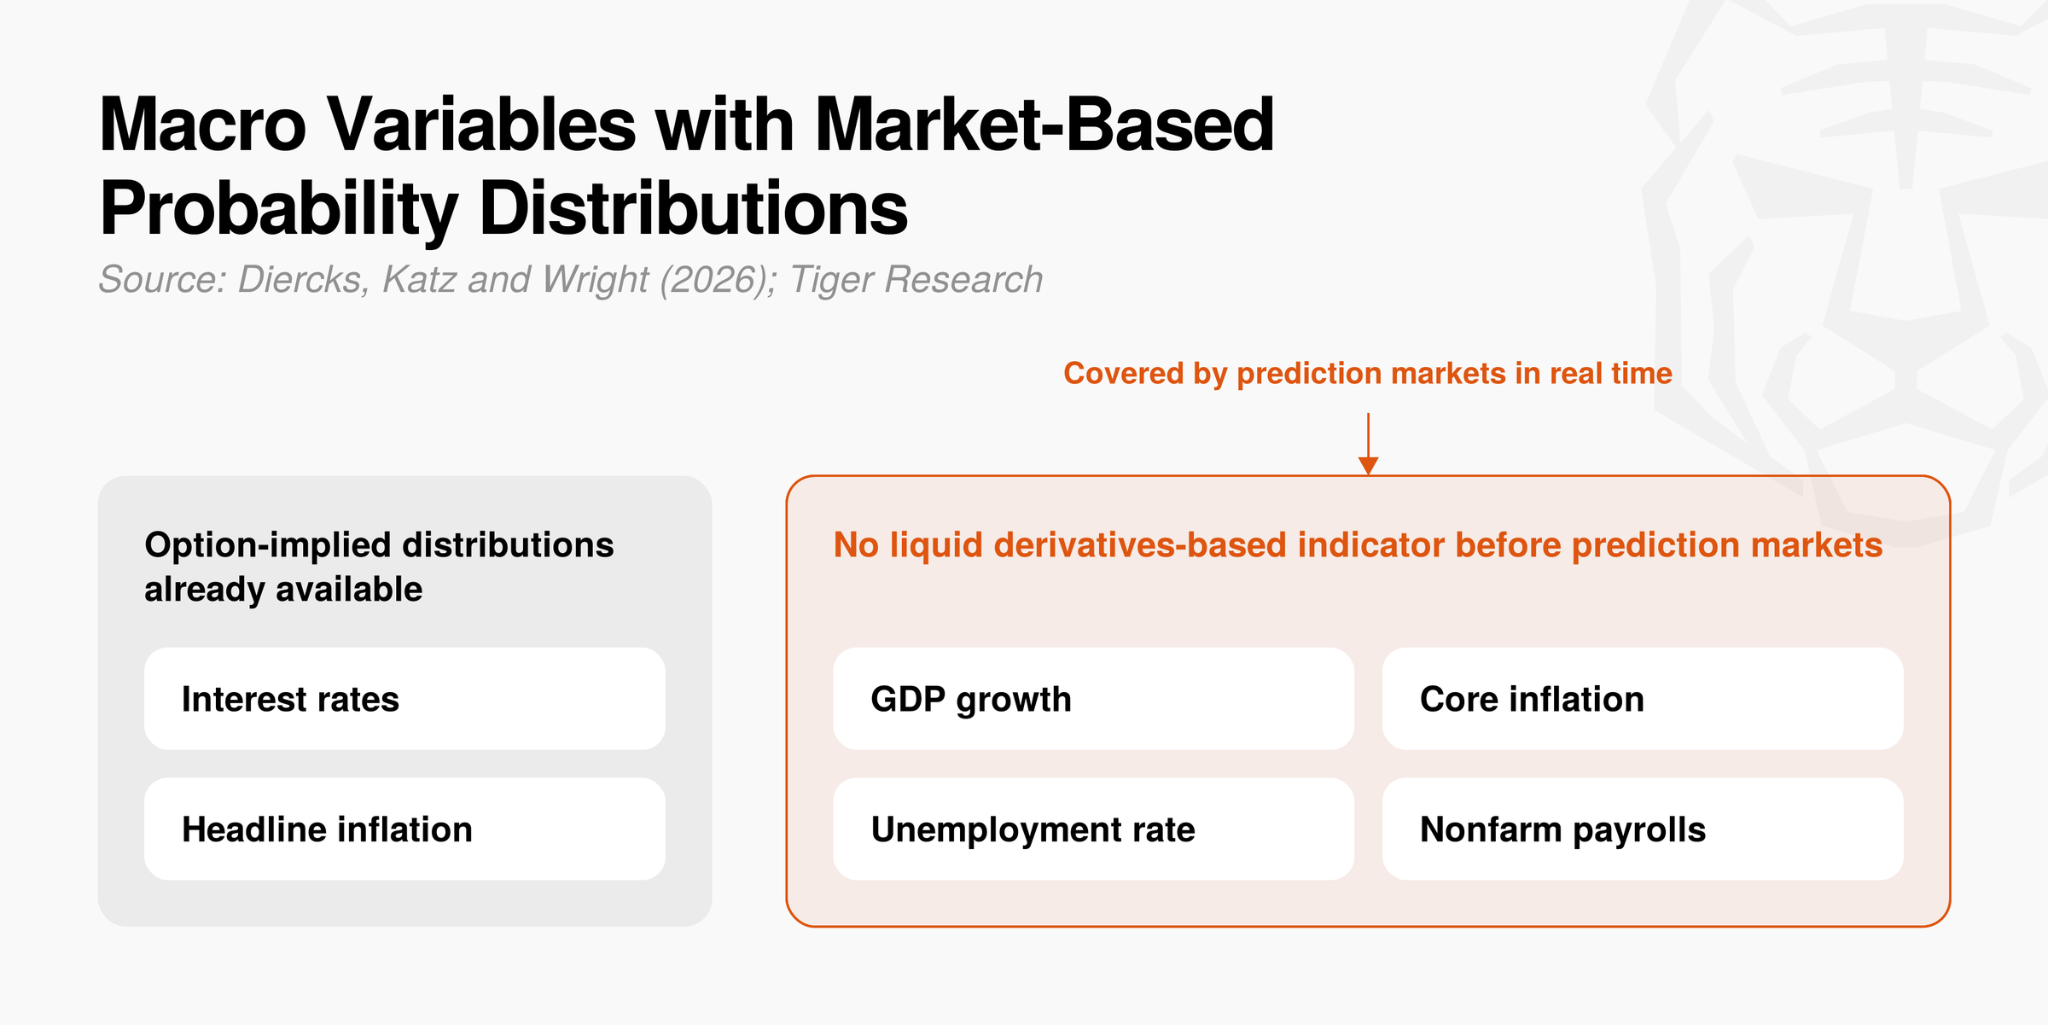
Prediction markets have been more accurate than traditional indicators for headline CPI and at least as accurate for interest rate decisions, and they also express macroeconomic expectations that traditional financial markets never covered as real-time probability distributions. This makes them a practical source of information.
3.3. Public Health: Flu Early Warning 2 to 4 Weeks Ahead
The US Centers for Disease Control and Prevention (CDC) publishes official flu statistics weekly, so there was a time lag in tracking how the flu was actually spreading.
To address this limitation, researchers at the University of Iowa ran a pilot prediction market for flu in which participating medical professionals traded. The market pooled the clinical information they provided voluntarily and predicted flu activity across Iowa two to four weeks in advance (Polgreen, Nelson, and Neumann, 2007).
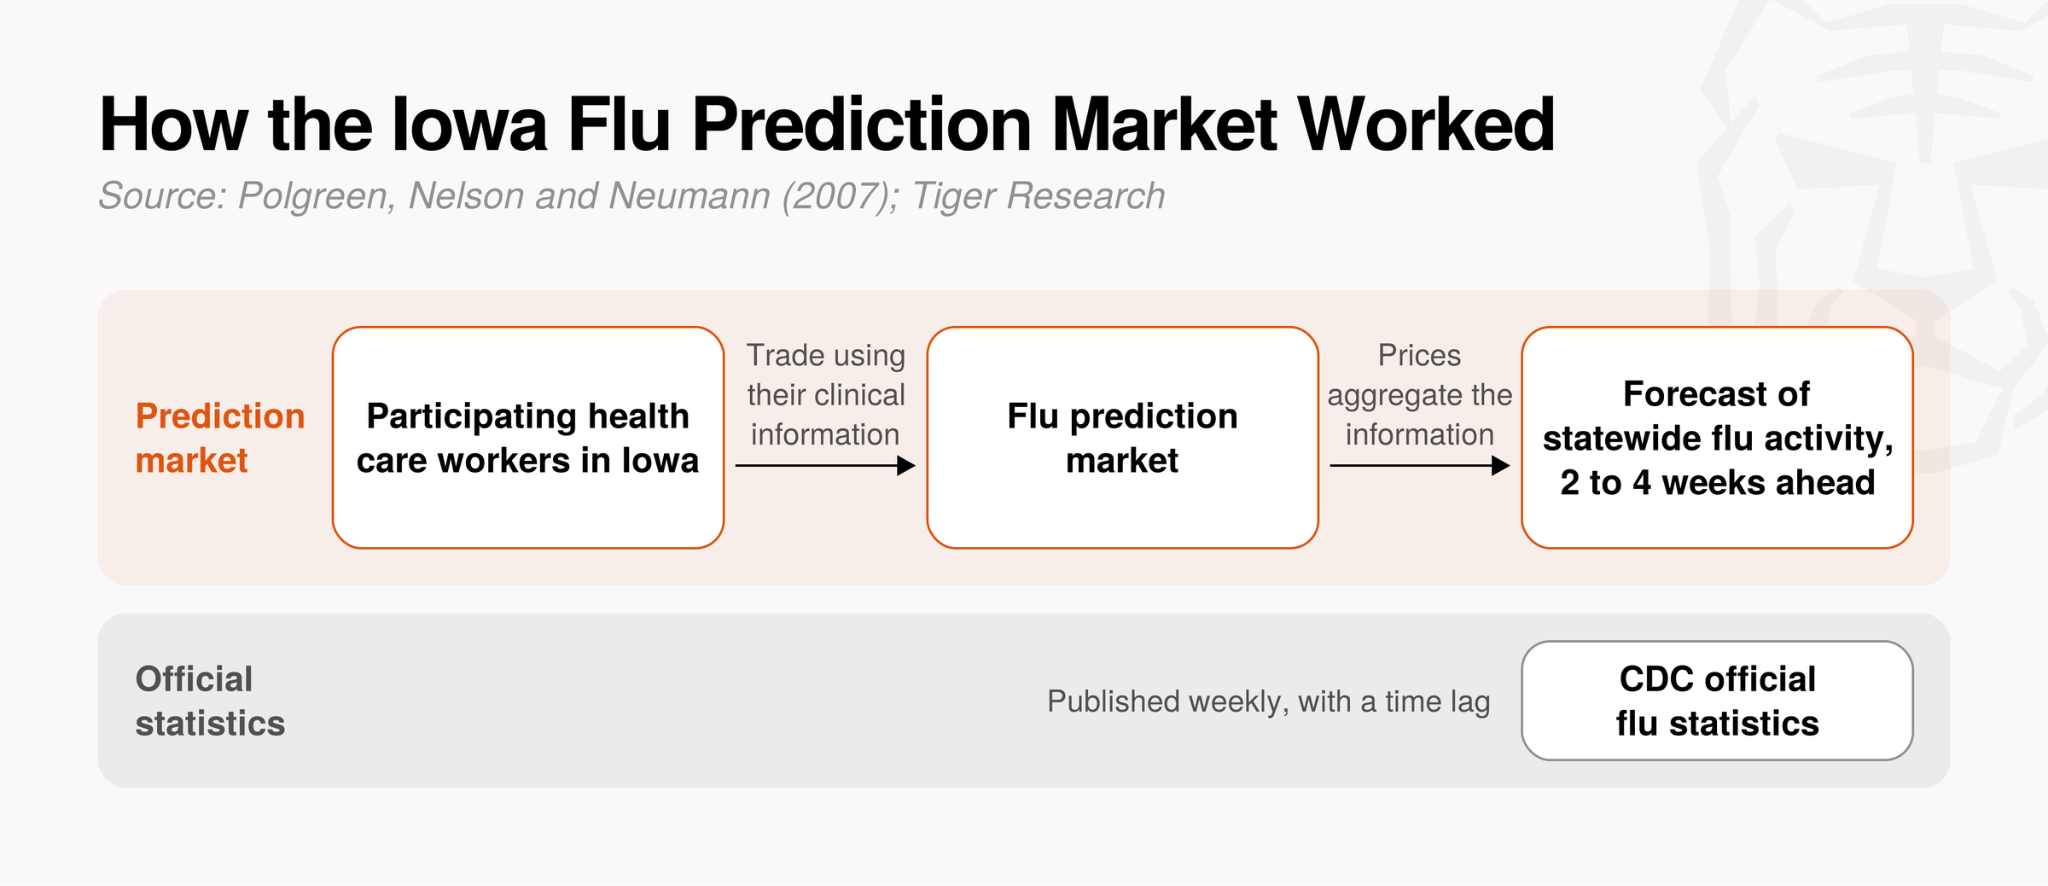
Such forecasts may help inform treatment, prevention, and policy decisions. The case showed that prediction markets can support rapid response in public health. However, it was a pilot study confined to the state of Iowa.
3.4. Companies and Intelligence Agencies: Information That Bypasses Reporting Lines
In a typical company, negative news and uncertain outlooks tend to be diluted or played down as they move up the reporting chain. An internal prediction market, by contrast, has employees bet directly on whether internal matters such as revenue, new product launch dates, and hiring will succeed, and rewards correct predictions. This bypasses rigid reporting lines and quickly gathers candid frontline judgment and information into prices.
HP: An internal sales prediction market traded by 20 to 26 active participants was more accurate than official management forecasts in 6 of the 8 comparable cases, and in all 8 it correctly identified the direction in which the official forecast was wrong (Chen and Plott, 2002).
Intel: More than half of the 979 internal prediction markets operated from 2006 to 2013 were more accurate than the company’s official forecasts (Gillen, Plott and Shum, 2017).
Ford: Based on trading in its internal features prediction market, the company said in 2011 that it had decided against including a Ford-branded bike carrier and an in-car vacuum in future models (Cowgill and Zitzewitz, 2015).
Google: A senior executive told a company-wide meeting that a goal of filling a senior leadership role had been missed for six consecutive quarters and that the internal prediction market had seen this coming (Cowgill and Zitzewitz, 2015).
Siemens: For a software project whose traditional project plan still showed the deadline as reachable, the internal prediction market warned of a delay of two to three weeks, and the project was in fact completed 13 days late (Ortner, 1998).
Prediction markets have also proved useful on national security and geopolitical questions. In a geopolitical forecasting tournament run by the US Intelligence Advanced Research Projects Activity (IARPA) from 2011 to 2015, researchers compared prediction markets with prediction polls (surveys of forecasters) over two seasons.
In forecasts of 261 events by more than 2,400 participants, prediction market prices were more accurate than the simple average of the poll responses in both seasons. They did not match team polls whose forecasts were weighted by past accuracy and statistically adjusted, but the result shows that prediction markets aggregate information well without further processing (Atanasov et al., 2017).
Inside companies, prediction markets have repeatedly been reported to capture information that official forecasts and reporting lines missed. In the intelligence tournament as well, prediction markets were more accurate than the simple average of poll responses. However, they did not match team polls whose forecasts were weighted by past accuracy, and some of the markets, such as those at HP and Siemens, had small trading populations of about 20 to 60 people, which is a limitation.
4. Do Today’s Prediction Markets Produce Valuable Data?
Do the prediction markets operating today also produce this kind of valuable data? To find out, we analyzed the market types and forecast accuracy using public API data from Limitless, an on-chain prediction market platform, as of October 2026.
4.1. Variety of Market Types
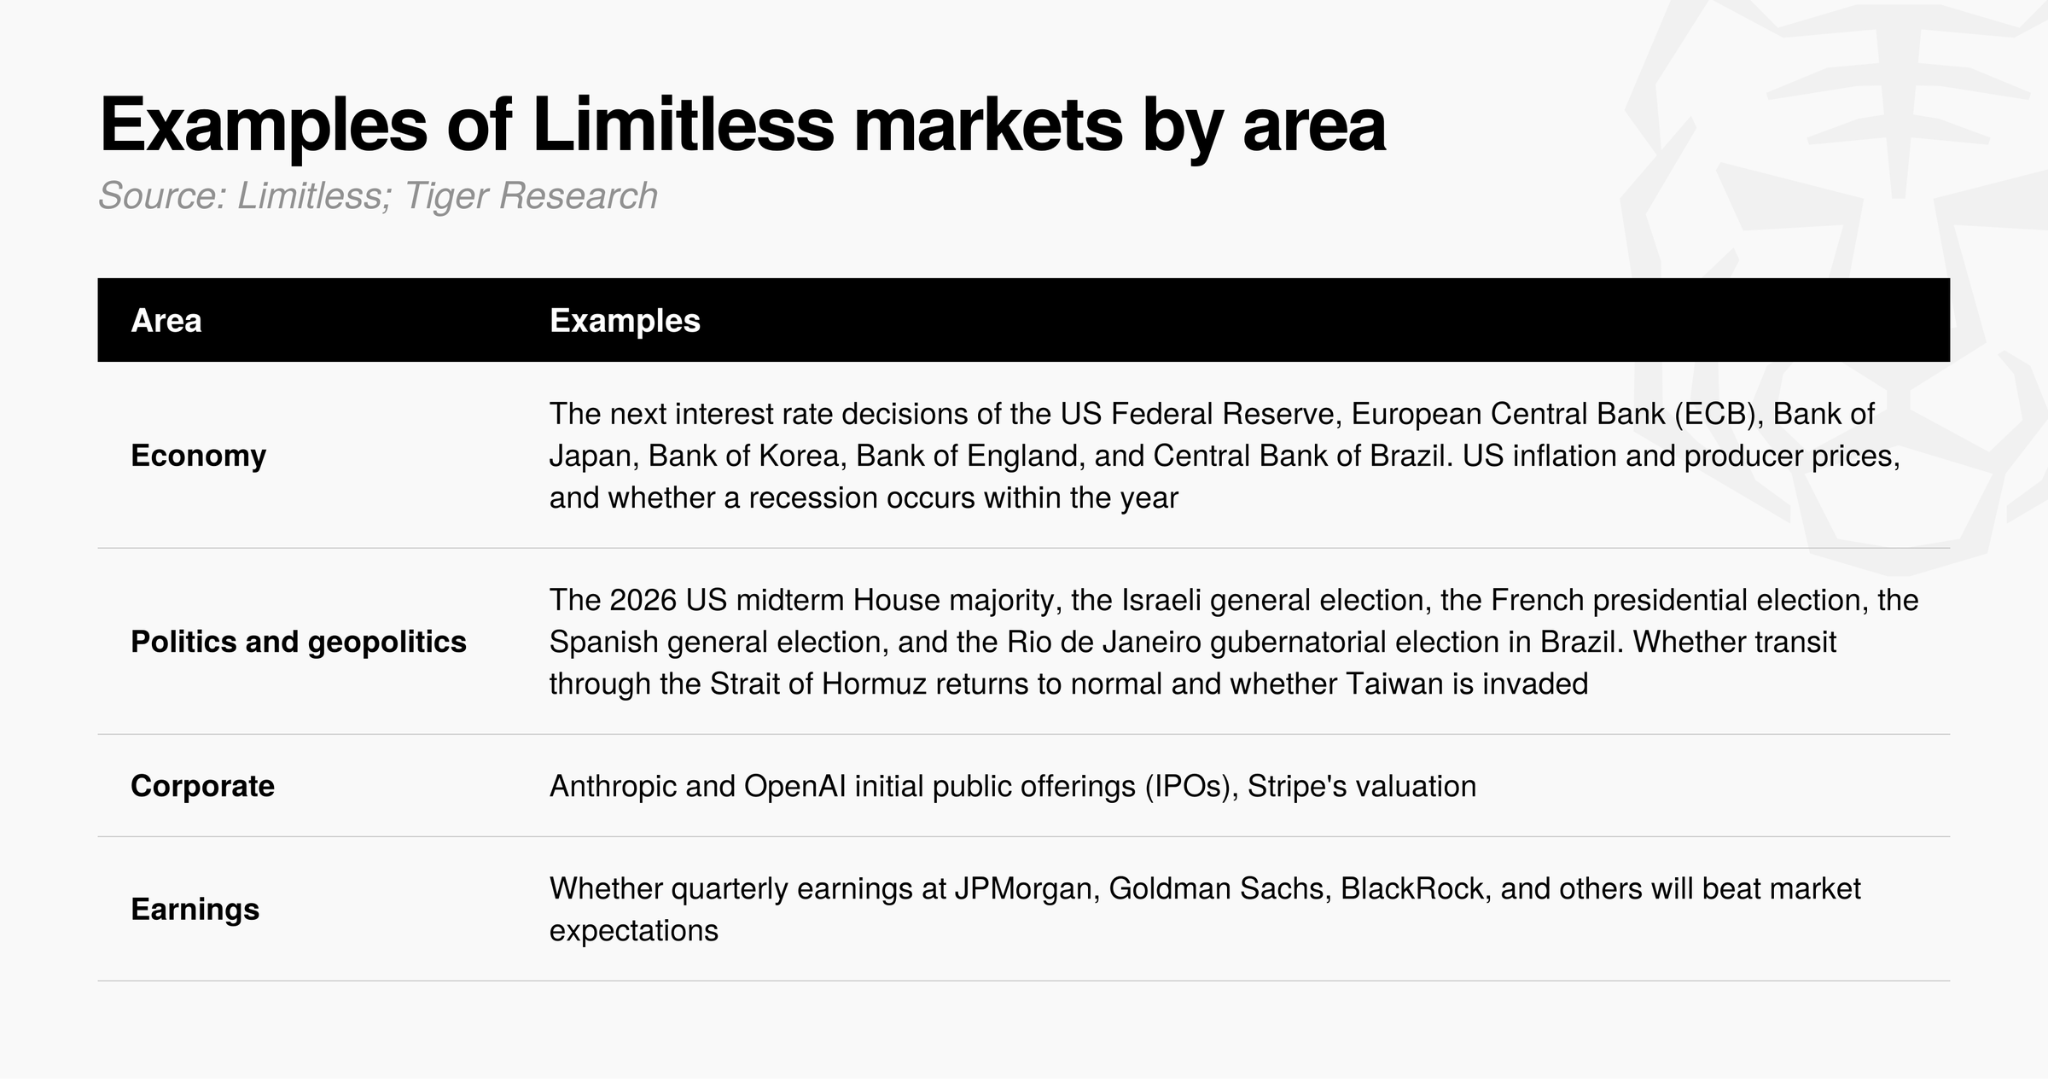
At the time of analysis, a total of 556 markets were open. Far from being limited to simple sports or entertainment events, they broadly cover policy and macroeconomic indicators as a whole, including interest rate decisions by major central banks, elections and geopolitical variables, and tech company IPOs and quarterly earnings.
Prediction markets, once confined to a few events, now cover macro indicators and policy variables across the board. This suggests that the utility verified in the earlier sections (accuracy, timeliness, and verifiability after the fact) is now extending beyond specific areas to the global economy and policy decisions generally.
Uncertainties and future volatility that traditional financial systems and polls struggled to capture are now quantified as reliable probability data, which market participants and policymakers can use as practical reference points for decisions.
4.2. Forecast Accuracy
To test how closely prices in these markets reflect the actual probability of events, we compared the price one day before the scheduled resolution time with the actual outcome in 2,681 resolved event markets from our collected sample (about 85% of them sports markets).
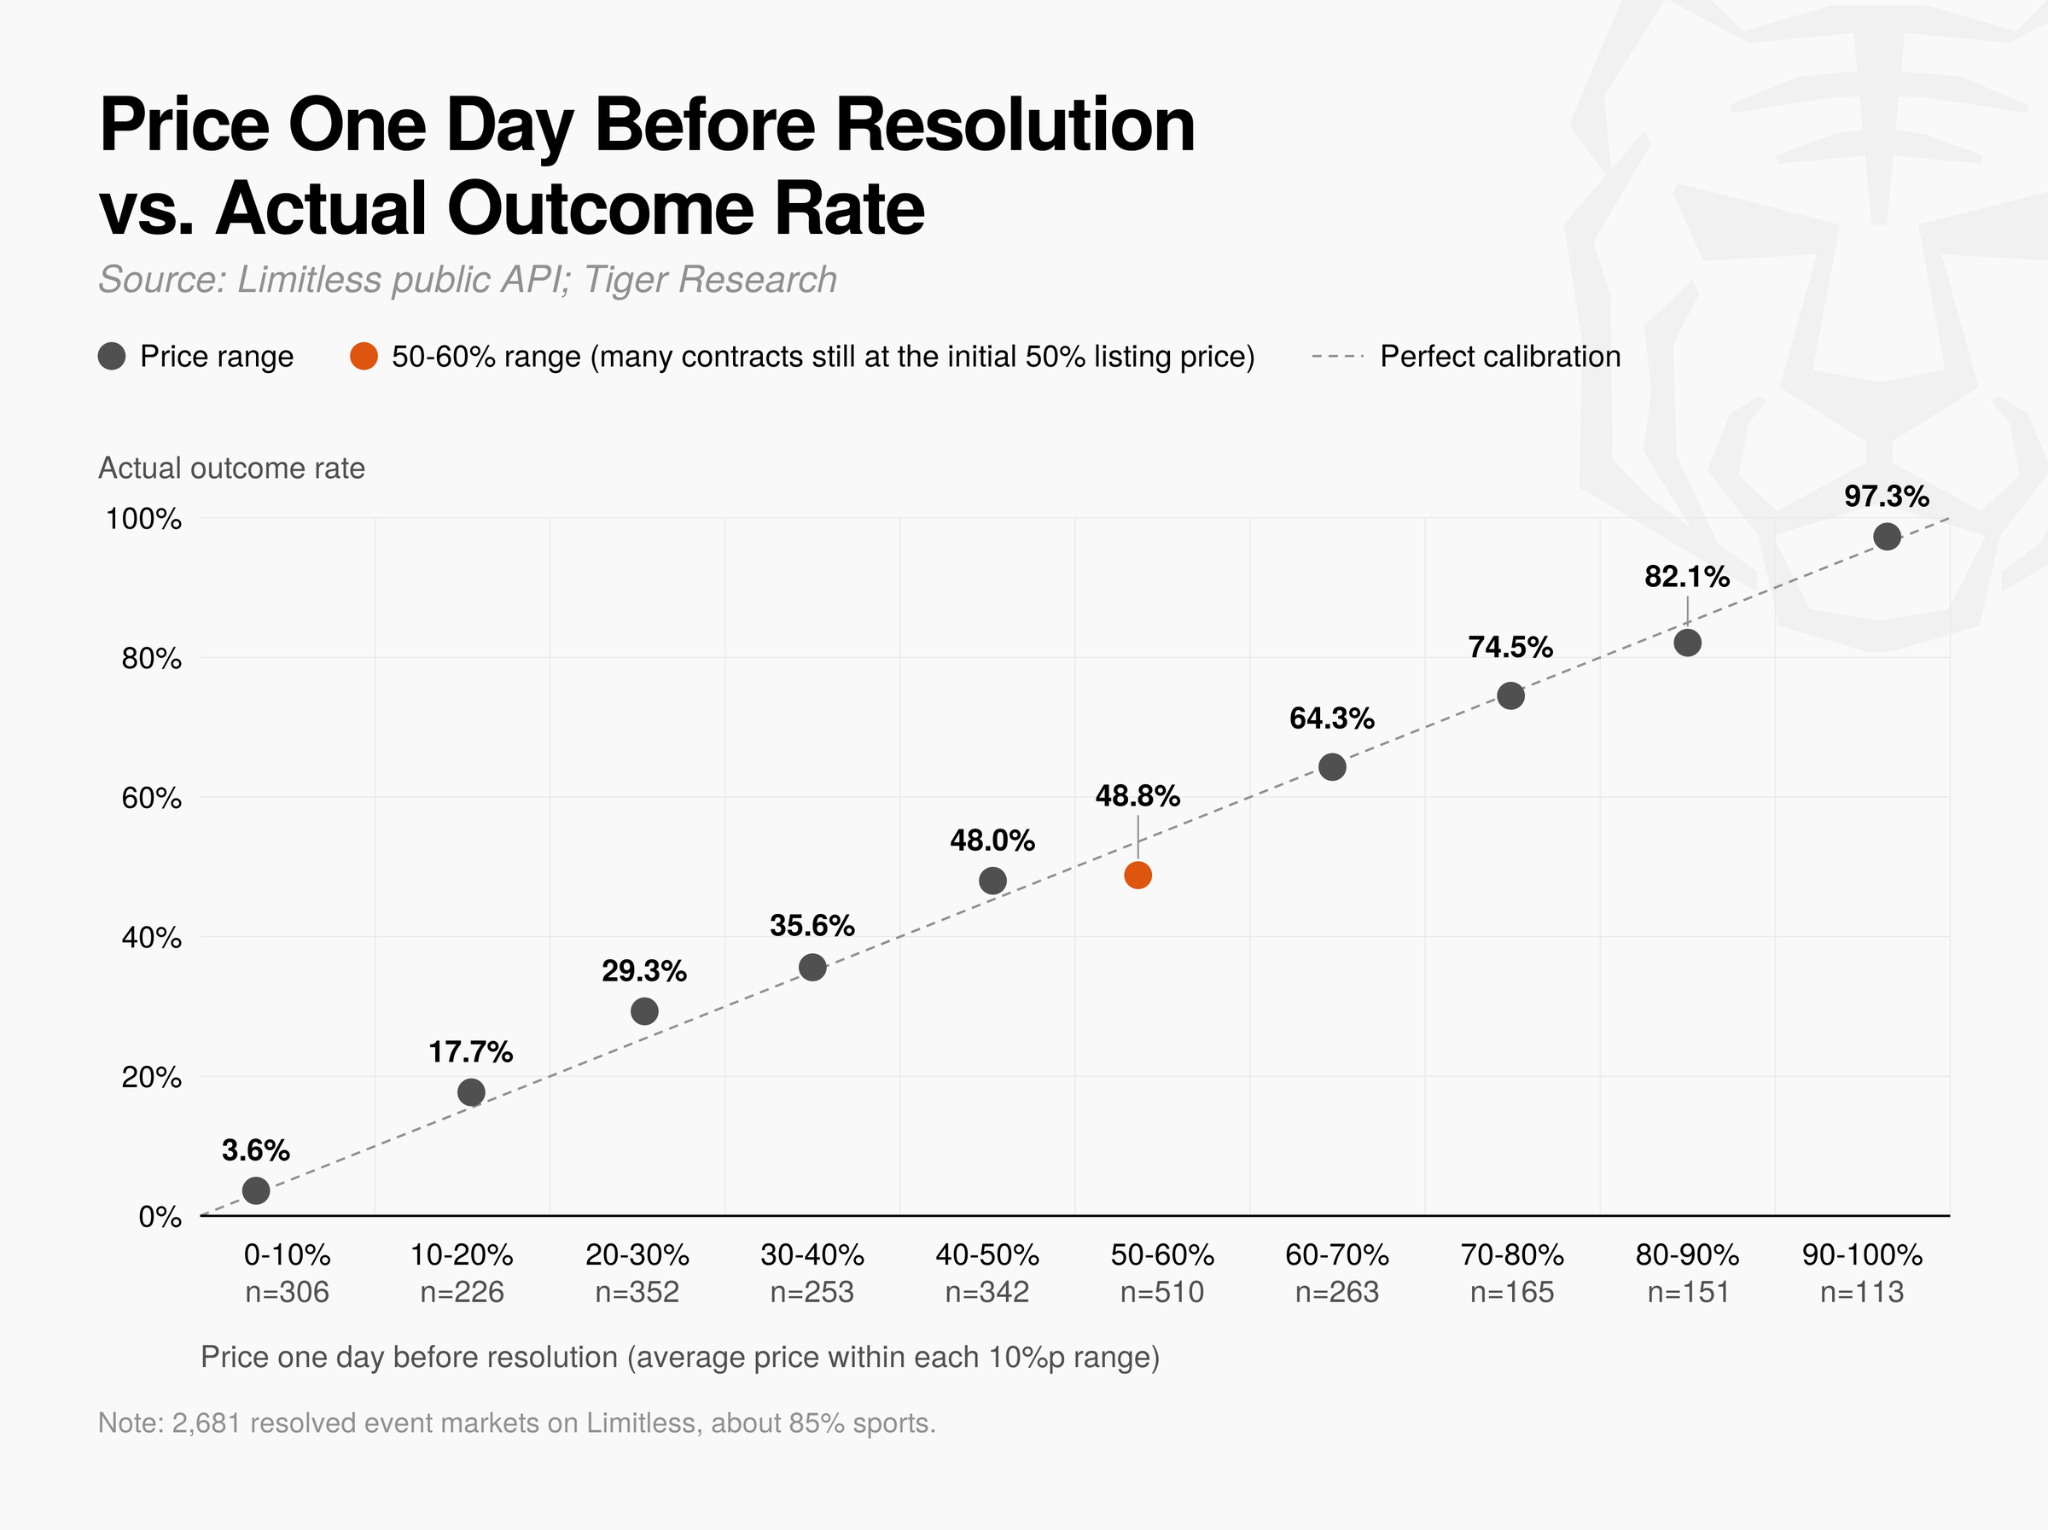
In 9 of the 10 price ranges, the gap between the actual outcome rate and the price was within 4 percentage points. For example, of 165 contracts priced at 70 to 80% one day before resolution, 74.5% actually came true, and of 113 contracts priced at 90% or above, 97.3% came true.
The only range with a notable error was 50 to 60% (actual occurrence rate of 48.8%), mainly because about a third of the contracts in this range, most of them sports markets, were still at their initial listing price of 50% one day before resolution.
Apart from these illiquid, less popular sports markets, prediction market prices reflect the actual probability of events with high precision.
4.3. Response to New Information
Timeliness is what supports this accuracy. To check whether prices reflect new information as soon as it arrives, we tracked the time series of prices on the Fed rate decision.
The Fed rate decision market adjusted its probabilities immediately whenever new economic data or policy variables were released. The probability of a rate hold, which stood at around 70% in mid-August, fell below 50% in late August and early September as major indicators were released,
dropped to about 20% right after the September 11 inflation data release, and then fell into the 10% range the day before the decision. The probability of a 0.25 percentage point increase, by contrast, rose to 86 to 89% on the day of the decision, almost the same as the roughly 90% probability implied by federal funds rate futures on CME FedWatch (Diercks, Katz and Wright, 2026; Daiwa Capital Markets, 2026). Limitless prices formed just before the decisions of other major central banks showed the same real-time responsiveness.
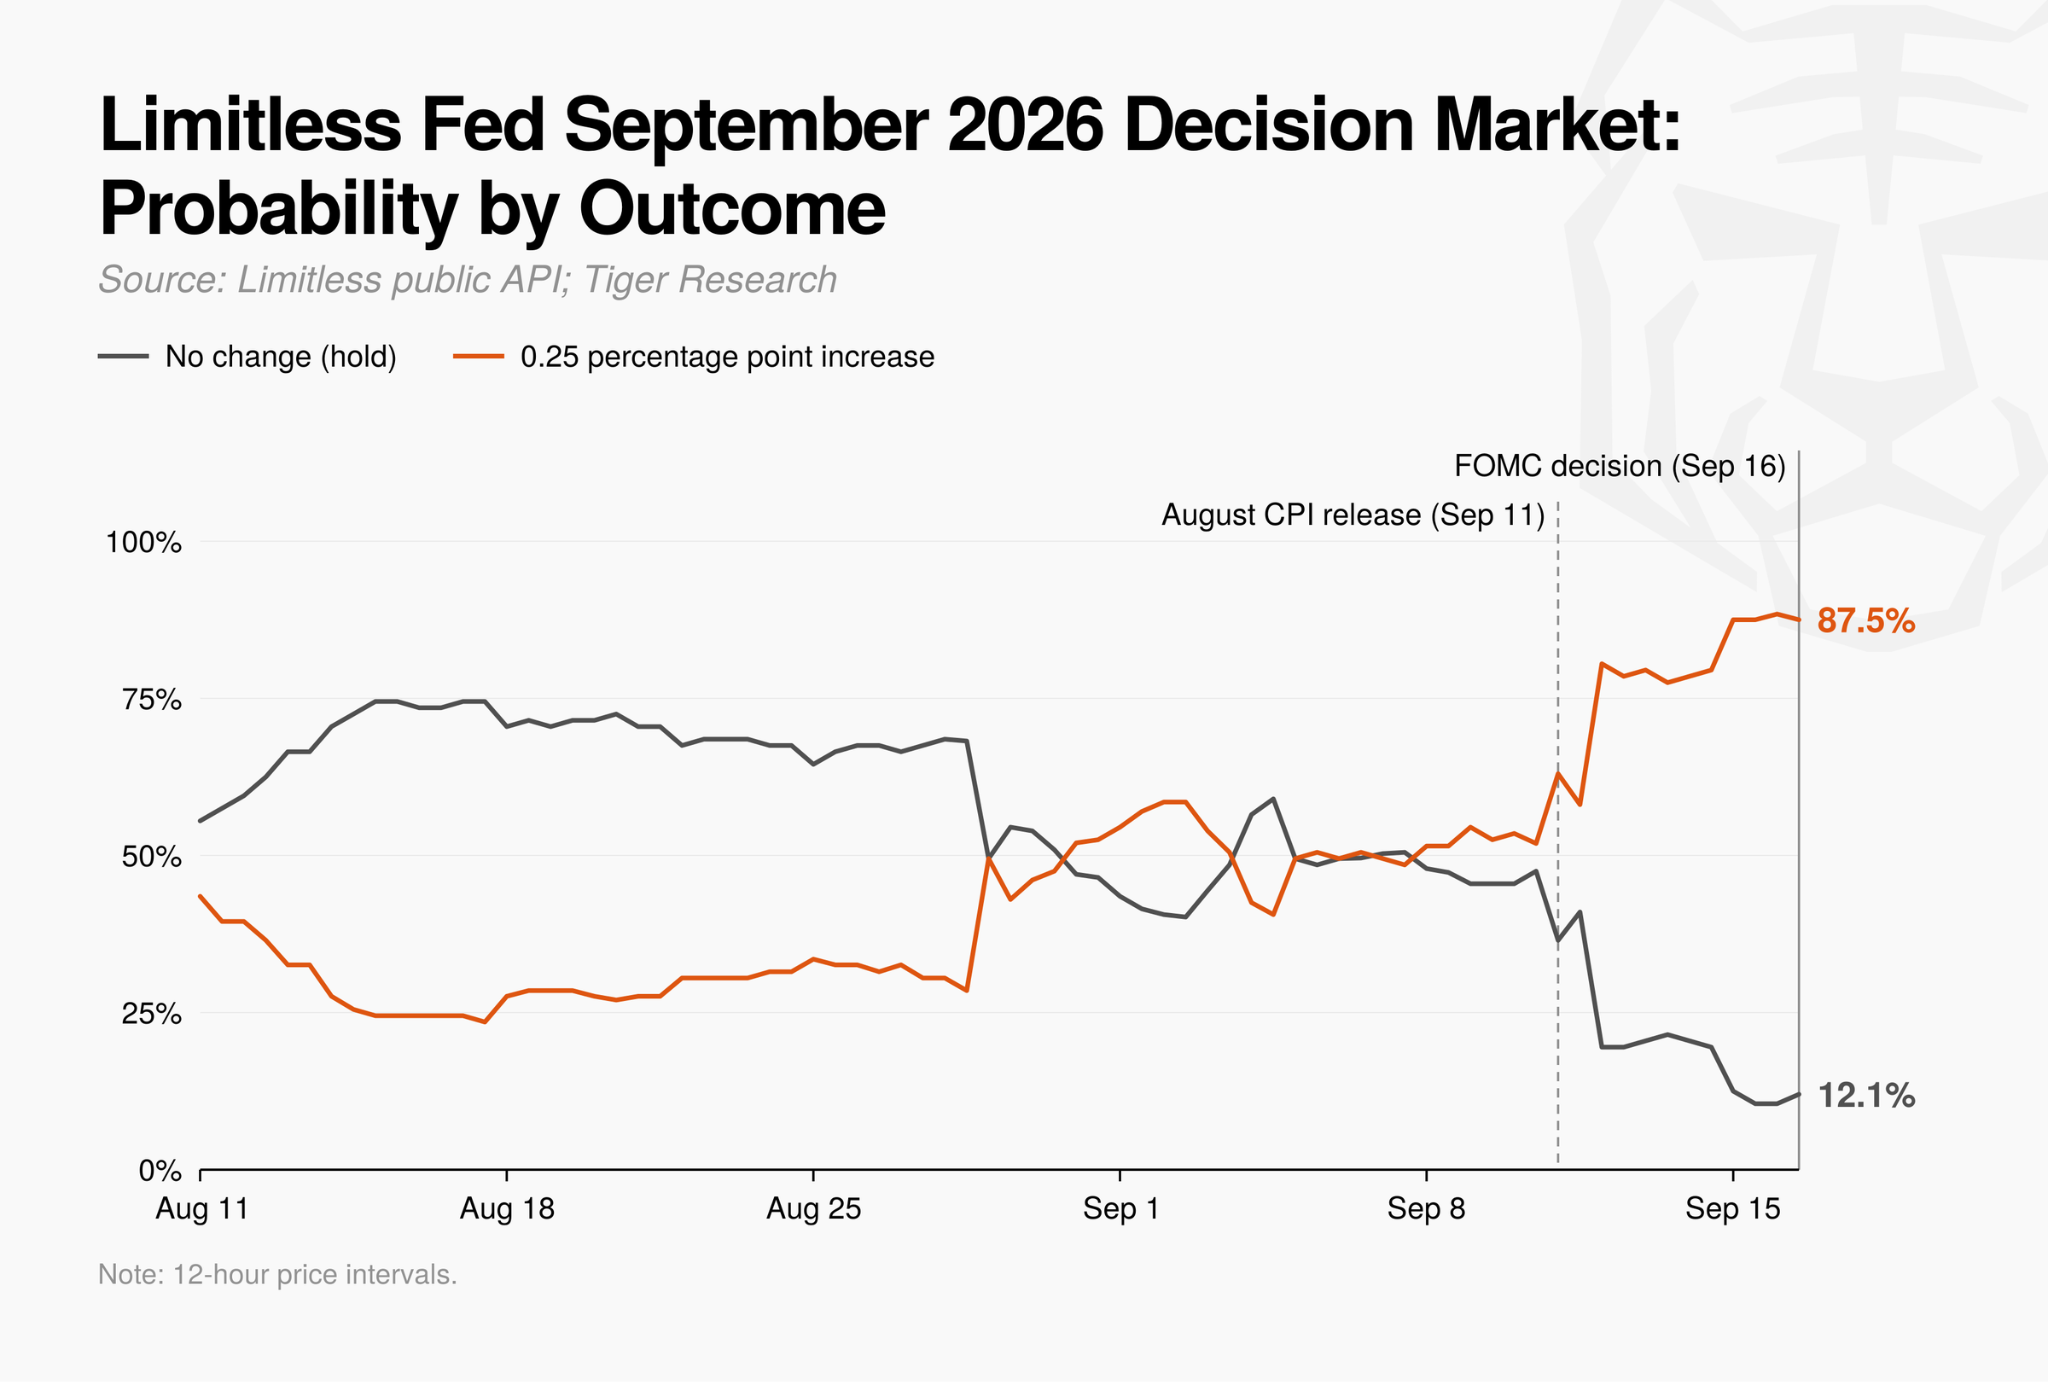
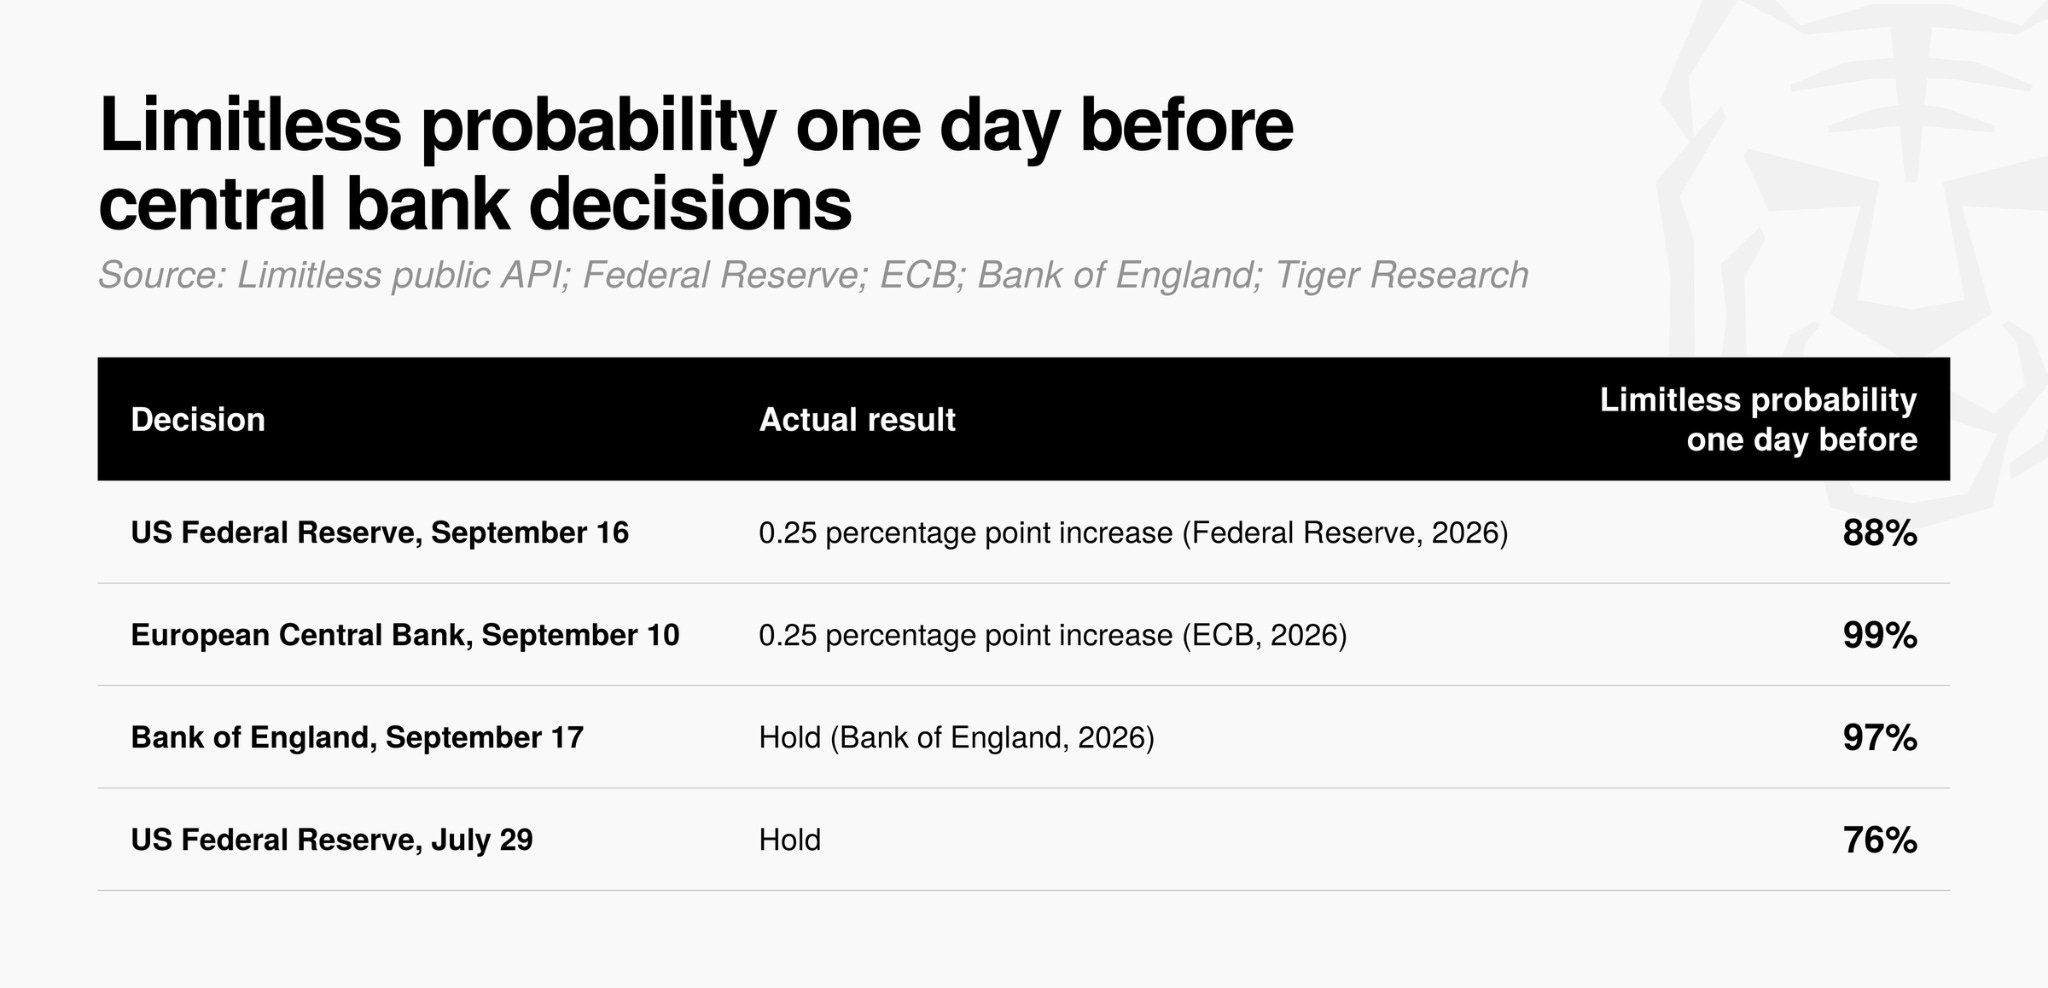
On-chain prediction market platforms operating today thus meet in practice the timeliness and accuracy that the earlier sections identified as core requirements of valuable data. These cases show that prediction market prices absorb incoming information in real time and continuously supply it as highly precise probability data.
5. Do Prediction Markets Deliver Real Utility?
As this report has shown, the essential value of prediction markets does not lie in speculative trading or profit. Long-accumulated academic research and the empirical analysis in this report show that prediction markets produce probability data whose accuracy and timeliness exceed or complement those of traditional surveys and expert forecasts in areas such as elections, macroeconomic indicators, and corporate outlooks. The move by global financial media and key market infrastructure to adopt prediction market data as a real-time indicator also rests on this practical utility.
In major Asian countries and elsewhere, prediction markets are still often viewed as gambling. This analysis shows, however, that prediction markets such as Limitless already list markets on major regional policy and economic issues, including the interest rate decisions of the Bank of Korea and the Bank of Japan, although trading in these markets is still thin.
For this data to become trusted decision-making infrastructure worldwide, including in Asia, three efforts are needed.
First, structural efforts are needed to reduce price distortion and eliminate market manipulation. Liquidity in markets for major macroeconomic and political events should be increased and the pool of healthy participants broadened, so that a small amount of capital or speculative actors cannot distort prices.
Second, active government relations (GR) and communication are needed to change policy perceptions of prediction markets. Policy authorities and regulators in major Asian countries should be engaged continuously, through a cooperative framework, so that they accept prediction markets not as targets of regulation or blocking but as a supplementary macroeconomic monitoring indicator that aggregates the collective knowledge of private participants.
Third, transparent data disclosure and an independent research community are needed. Accuracy metrics and time-series datasets should be published regularly and openly, and research by specialized analysts such as Limitless Research should be encouraged, so that research institutions, the media, and policy authorities can easily access the data and trust it on the basis of objective evidence.
Prediction market platforms are at a turning point, evolving from simple trading venues into next-generation data infrastructure. If real-time probability data that closely tracks policy and economic issues worldwide, including in Asia, can be supplied and verified transparently, it can serve as an objective and useful tool for decisions under future uncertainty.
🐯 More from Tiger Research
Read more reports related to this research.Zuckerberg Is Building a Prediction Market. Asia Still Calls It Gambling.
One Platform, All Assets: What Polymarket's Perpetuals Launch Reveals
Disclaimer
This report was partially funded by Limitless. It was independently produced by our researchers using credible sources. The findings, recommendations, and opinions are based on information available at publication time and may change without notice. We disclaim liability for any losses from using this report or its contents and do not warrant its accuracy or completeness. The information may differ from others’ views. This report is for informational purposes only and is not legal, business, investment, or tax advice. References to securities or digital assets are for illustration only, not investment advice or offers. This material is not intended for investors.
Terms of Usage
Tiger Research allows the fair use of its reports. ‘Fair use’ is a principle that broadly permits the use of specific content for public interest purposes, as long as it doesn’t harm the commercial value of the material. If the use aligns with the purpose of fair use, the reports can be utilized without prior permission. However, when citing Tiger Research’s reports, it is mandatory to 1) clearly state ‘Tiger Research’ as the source, 2) include the Tiger Research logo. If the material is to be restructured and published, separate negotiations are required. Unauthorized use of the reports may result in legal action.


